Quick Answer
CI/CD monitoring tracks pipeline and delivery signals so teams can detect failures, bottlenecks, flaky tests, and release risks before they impact production environments. As software delivery pipelines grow in complexity, maintaining deep observability into every build stage becomes essential for engineering velocity and system stability. Without robust monitoring, pipelines turn into opaque black boxes where regressions go unnoticed until code reaches production.
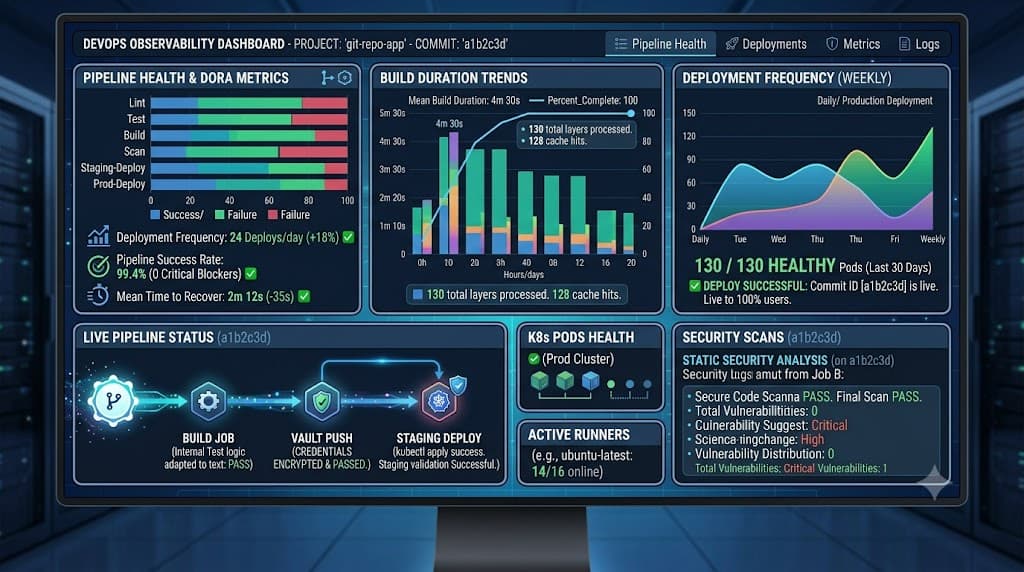
Effective monitoring requires more than simply checking whether a build passed or failed. It involves collecting granular data across execution stages, analyzing build duration trends, evaluating queue times, tracking deployment frequency, and measuring lead time for changes. By pairing these metrics with structured log analysis and targeted alerts, teams can transform their release workflows from reactive troubleshooting engines into predictable, highly optimized delivery systems.
Why Monitor CI/CD?
Monitoring your continuous integration and continuous deployment pipelines bridges the historic gap between developer velocity and production stability. When teams push code rapidly without rigorous pipeline observability, minor configuration drift, unoptimized test suites, or resource starvation on build agents can quietly degrade delivery performance. Pipeline observability acts as the nervous system of modern software engineering, providing continuous feedback on how changes move from code repositories to deployment targets.
One major driver for implementing rigorous monitoring is the prevention of feedback loops from slowing down development. If a test suite takes forty minutes to execute and frequently errors out due to transient network timeouts, developers spend hours context-switching while waiting for feedback. Monitoring exposes these hidden productivity drains. By quantifying build duration, queue times, and step-level latency, engineering organizations can systematically eliminate bottlenecks.
Another critical reason to prioritize pipeline observability is safeguarding deployment safety. Modern delivery systems automate complex release patterns, including rolling updates, canary releases, and blue-green deployments. If the pipeline itself is unhealthy—such as failing to run critical security scans or skipping smoke tests due to misconfigured conditionals—defective code can bypass safety gates. Monitoring ensures that compliance checks, automated tests, and verification steps execute reliably every single time.
Finally, treating the pipeline as a first-class product requires continuous measurement. Just as production microservices require Application Performance Monitoring (APM), your build agents, runners, and artifact repositories demand dedicated instrumentation. Establishing clear baselines allows engineering leadership to correlate pipeline health with business outcomes, demonstrating how investments in infrastructure and developer experience directly impact time-to-market.
Core Metrics
To effectively evaluate delivery performance, engineering teams must track a specific set of core quantitative signals. Relying on gut feeling or anecdotal complaints about slow builds is insufficient; precise data is required to diagnose systemic issues. Below are the primary metrics that form the foundation of comprehensive pipeline observability.
Pipeline Duration and Queue Time
Pipeline duration measures the total elapsed time from the moment a trigger event occurs—such as a git push or a merged pull request—to the final completion of all pipeline stages. This metric directly influences developer feedback loops. If your duration creeps upward over time, it often signals growing test suites, unoptimized container image builds, or resource contention.
Queue time represents the duration a job spends waiting in a pending state before an available runner or build agent picks it up. High queue times indicate resource starvation. For example, if your self-hosted runner pool is consistently maxed out during peak engineering hours, jobs sit idle. Tracking queue time separately from execution time ensures you do not mistake infrastructure scaling issues for slow test execution.
Deployment Frequency and Lead Time
Deployment frequency measures how often successful releases are pushed to production or staging environments. High deployment frequency is a hallmark of mature DevOps organizations, reflecting small, incremental batch sizes. When monitoring deployment frequency, look for sudden drops, which often indicate blocked pipelines, stuck manual approval gates, or widespread test failures.
Lead time for changes tracks the total duration required for a commit to successfully execute through the pipeline and land in production. Unlike build duration—which only measures the active execution within the runner—lead time encompasses code review time, queue time, build execution, staging validation, and final deployment. Measuring lead time helps organizations identify where code spends the majority of its lifecycle.
Practical Measurement Example
Consider a typical cloud-native application pipeline operating on a Kubernetes-backed CI/CD platform. By exporting telemetry data to a metrics store, you can visualize these core signals over time. For instance, tracking deployment frequency might reveal that your team averages twelve deployments per day on Tuesdays and Wednesdays, but drops to two per day on Fridays due to weekend freeze policies or risky end-of-week merges. Pinpointing these temporal patterns allows engineering managers to optimize release schedules and runner capacity.
Failure Analysis
When a pipeline breaks, understanding the root cause quickly is paramount. Failure analysis involves examining failure rates, error isolation, and recurring failure modes across different stages of the delivery lifecycle. A failure rate that trends upward over time points to deteriorating code quality, unstable integration environments, or broken dependency registries.
Error Isolation and Stage Breakdown
Effective failure analysis requires breaking down failures by pipeline stage: linting, unit testing, integration testing, container building, and deployment. If ninety percent of failures occur in the integration testing stage due to database connection timeouts, you know precisely where to focus engineering effort. Grouping failures by error type prevents teams from treating every broken build as a unique anomaly.
Analyzing Pipeline Logs and Build Duration Anomalies
When investigating individual failures, engineers rely heavily on pipeline logs. Examining raw log output from failed steps helps isolate syntax errors, missing environment variables, or flaky network calls. However, logs alone can be overwhelming. Modern observability practices correlate log output with build duration anomalies. For example, if a normally five-minute build suddenly runs for sixty minutes before timing out, log analysis should immediately target infinite loops, hanging database migrations, or blocked resource locks.
Common Failure Modes
- Dependency Resolution Failures: External package registries (such as npm, PyPI, or Maven Central) experiencing rate limiting or downtime, causing build steps to fail before compilation begins.
- Resource Exhaustion: Build agents running out of memory during heavy container image builds or parallelized test runs, resulting in unceremonious OOMKilled exits.
- Environment Drift: Discrepancies between local developer environments and remote runner environments, leading to test failures that cannot be reproduced locally.
Flaky Tests
Flaky tests—tests that pass or fail intermittently without any changes to the underlying code—are among the most insidious threats to pipeline health. They erode developer trust in the CI/CD system. When engineers see a test fail, their default assumption is often that the test is flaky rather than that the code contains a genuine bug, leading them to blindly re-run the pipeline until it passes.
Detecting and Isolating Flaky Pipelines
Detecting flaky tests requires tracking test execution history across multiple runs. A test that fails on ten percent of commits without corresponding code changes is a primary candidate for refactoring or quarantining. Many modern test runners and CI/CD platforms provide built-in flaky test detection by automatically retrying failed tests and flagging those that succeed on subsequent attempts.
Impact on Build Duration and Developer Velocity
Flaky tests artificially inflate build duration and waste compute resources. If a pipeline requires three manual or automated re-runs to achieve a green status due to a single race condition in an integration test, the effective build duration triples. Furthermore, developers waste productive hours waiting for re-runs and debugging phantom failures.
Verification and Mitigation Strategies
To mitigate flaky tests, teams should implement strict isolation techniques:
- Eliminate Shared State: Ensure integration tests do not rely on shared, mutable database records without proper transaction rollback mechanisms.
- Mock External Services: Replace fragile network calls to external APIs with deterministic mocks or contract tests.
- Audit Timing Assertions: Remove tests that depend on arbitrary sleep timers, replacing them with explicit asynchronous event polling.
Logs and Alerts
Logs provide the granular forensic detail required to debug pipeline failures, while alerts ensure engineers are notified of critical delivery bottlenecks without drowning in notification noise.
Pipeline Log Analysis
Pipeline logs capture the stdout and stderr streams of every command executed by build agents. Effective log management involves capturing structured logs (such as JSON-formatted output) and tagging them with metadata like job ID, commit hash, author, and branch name. This allows engineers to query logs across historical builds to identify recurring patterns, such as deprecation warnings from underlying compilers or intermittent timeout errors from cloud storage buckets.
Actionable Alerting Strategies
To prevent alert fatigue, alerts should be purposeful, targeted, and actionable. Avoid paging engineers for transient, single-instance test failures that resolve on automatic retry. Instead, configure alerts based on threshold violations and systemic degradation:
- Elevated Failure Rate: Alert when the rolling failure rate across the main branch exceeds a specific percentage over a sliding time window (e.g., twenty percent failure over the last two hours).
- Queue Time Spikes: Alert when average queue time exceeds operational thresholds, indicating runner infrastructure starvation.
- Stuck Pipelines: Alert when a job exceeds its maximum expected build duration by a defined multiplier.
Baselines depend entirely on the team and system. A monolithic repository with heavy integration suites will naturally have longer build durations and different failure tolerances than a small microservice repository. Avoid adopting universal target thresholds from industry benchmarks without tailoring them to your infrastructure.
Improvement Loop
Observability is only valuable if it drives continuous improvement. Synthesizing pipeline metrics, failure analysis, and log data creates an actionable feedback loop that systematically enhances team and system performance.
Closing the Feedback Loop
Start by reviewing pipeline metrics during regular engineering retrospectives. If failure rates spike in a specific service, schedule a targeted debugging session to address flaky tests or brittle dependencies. If queue times grow, provision additional auto-scaling runner agents before developer velocity stalls.
By treating pipeline health as an ongoing engineering initiative rather than a set-and-forget configuration, organizations can ensure their delivery pipelines scale gracefully alongside their codebase and team size.
📌 Recommended Next Guides & References
  <li>
    <a href="/article/docker-and-kubernetes-how-they-work-together-2" class="text-primary hover:underline font-semibold flex items-center gap-2">
      <span>→</span> <span>Docker and Kubernetes: How They Work Together</span>
    </a>
  </li>

  <li>
    <a href="/article/kubernetes-ingress-explained" class="text-primary hover:underline font-semibold flex items-center gap-2">
      <span>→</span> <span>Kubernetes Ingress Explained: Routing, Controllers, and TLS</span>
    </a>
  </li>

  <li>
    <a href="/article/kubernetes-ingress-controller-explained" class="text-primary hover:underline font-semibold flex items-center gap-2">
      <span>→</span> <span>Kubernetes Ingress Controller Explained: Architecture, Routing, and Implementation</span>
    </a>
  </li>


