Quick Answer
Checking storage utilization is an everyday task for anyone managing Linux environments, whether you are running a local development machine, maintaining a production server, or orchestrating containers in a cluster. When you need a fast and accurate way to linux check disk space, the GNU Coreutils package provides two foundational command-line utilities: df and du. By understanding how these tools operate under the hood, developers and system administrators can quickly diagnose storage bottlenecks, prevent service outages, and maintain robust infrastructure.
Quick Answer
To instantly inspect overall filesystem capacity and available storage in Linux, run the df command with human-readable output:
df -h
This command displays all mounted filesystems, their total sizes, used space, available space, percentage utilization, and mount points. If you need to check disk space linux at the directory level to find out which specific folders or files are consuming the most space within a particular path, use the du command combined with summary and human-readable flags:
du -sh /var/log/*
These two utilities form the core toolkit for everyday storage management, letting you transition smoothly from a high-level overview of disk utilization down to granular file-level investigation.
Understanding Linux Disk Space Concepts
Before diving into specific command flags and terminal outputs, it is essential to understand the underlying architecture of Linux storage. Unlike some operating systems that abstract disk management behind monolithic partitions or drive letters, Linux treats everything as part of a unified, hierarchical directory tree. This structure is built on top of filesystems, inodes, blocks, and mount points.
Filesystems and Mount Points
A Linux filesystem organizes data on a storage device or partition. Common filesystem types include ext4, XFS, Btrfs, and network-mounted filesystems like NFS. A mount point is a directory within the global directory tree where a filesystem is attached, making its contents accessible to users and processes. For instance, the root directory / represents the primary mount point for the main operating system partition, while /mnt/data might point to an attached cloud block storage volume.
Blocks and Inodes
Underneath the directory tree, storage is divided into fixed-size units called blocks, which physically hold the file data. Alongside data blocks, Linux filesystems use inodes (index nodes) to store metadata about every file and directory—including permissions, ownership, timestamps, and block locations—excluding the actual file name and data content. A critical nuance for developers is that a filesystem can run out of inodes even when free space remains in blocks, typically occurring when an application generates millions of tiny files, such as cache entries or temporary build artifacts.
How It Works: The Architecture of Storage Commands
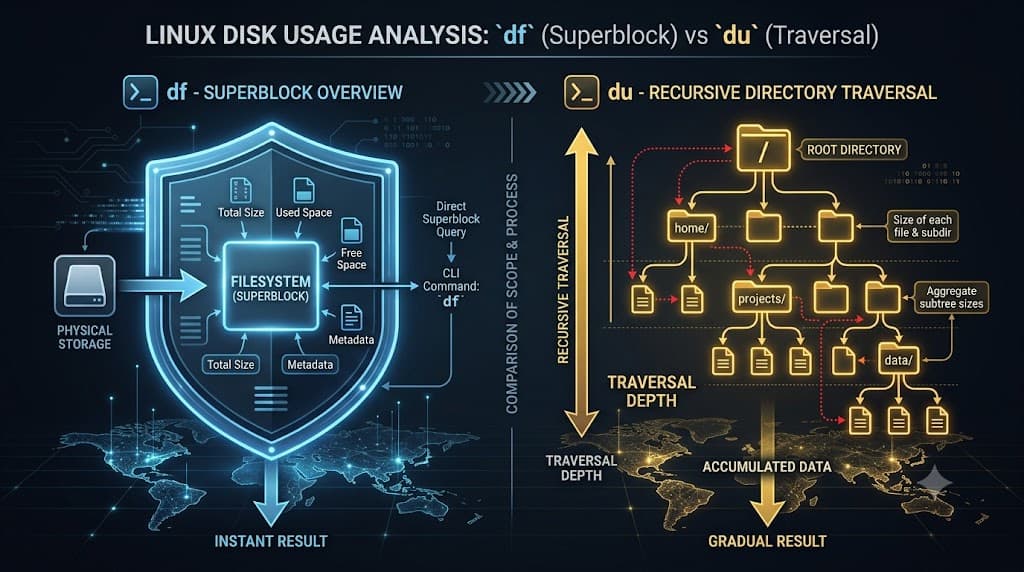
Understanding how storage utilities retrieve their information helps clarify why different commands sometimes report divergent numbers. The Linux kernel maintains active tracking of all mounted filesystems, open file descriptors, and active I/O operations in memory. When you execute a user-space utility like df or du, the command makes system calls to query the kernel for filesystem statistics.
The df Utility Mechanism
The df (disk free) command queries the kernel for superblock information from each mounted filesystem. Because it reads the filesystem superblock directly rather than recursively scanning individual directory trees, df executes nearly instantaneously, regardless of how massive the underlying storage volume is. This makes df exceptionally lightweight and ideal for automated health checks and monitoring scripts.
The du Utility Mechanism
In contrast, the du (disk usage) command operates by recursively walking down the directory tree from a specified starting point. For every file and directory encountered, du reads the file metadata and sums up the block allocations. Because it must traverse every subdirectory and inspect individual files, du is significantly more resource-intensive and slower on large directories or network shares, but it provides unmatched precision for isolating space hogs.
Practical Commands and Examples
Mastering the syntax and flags of df and du allows you to tailor your storage queries to any troubleshooting scenario. Below are practical, real-world examples with expected behaviors and verification steps.
Using the df Command for High-Level Overview
To inspect all standard local filesystems with human-readable values (gigabytes and megabytes instead of raw 1024-byte blocks), use the -h flag:
df -h
Expected output format:
Filesystem      Size  Used Avail Use% Mounted on
/dev/sda1        50G   18G   30G  38% /
tmpfs           3.9G     0  3.9G   0% /dev/shm
/dev/sdb1       100G   75G   20G  79% /mnt/data
If you want to verify inode consumption—which is crucial when troubleshooting mysterious application crashes caused by exhausted metadata—add the -i flag:
df -hi
This command displays total inodes, used inodes, free inodes, and percentage utilization for each mounted filesystem.
Using the du Command for Directory-Level Analysis
When a particular partition appears full in df, you need du to pinpoint the culprit. To view the disk usage of every immediate subdirectory within /var in a human-readable format, run:
du -h --max-depth=1 /var
To sort these directories by size from largest to smallest for rapid identification of storage hogs, pipe the output into sort:
du -h --max-depth=1 /var | sort -hr
To verify the total size of a single specific directory, such as a local build cache or log directory, use the summary flag -s:
du -sh /var/log
Developer and DevOps Context
In modern software engineering, monitoring disk space extends far beyond single-server administration. Containers, orchestration engines, and continuous integration pipelines introduce unique storage challenges that require proactive management.
Docker Volume and Image Accumulation
Docker environments frequently suffer from unexpected disk exhaustion due to dangling images, stopped containers, build caches, and unpruned volumes. While standard host commands show overall consumption, Docker manages its own storage drivers (such as overlay2). To check disk space utilization specific to the Docker daemon, use:
docker system df
This command breaks down storage used by containers, images, and local volumes, providing actionable insights before cleanup operations like docker system prune are executed.
Kubernetes Node Storage Pressure
In Kubernetes clusters, worker nodes can trigger storage pressure evictions if ephemeral storage usage exceeds configured thresholds. DevOps engineers frequently inspect ephemeral storage consumption inside pods or check node-level storage constraints using kubectl combined with node shell access or integrated monitoring agents like Prometheus and Grafana. Ensuring that container logging frameworks implement strict log rotation prevents runaway log files from filling up /var/lib/docker or node root partitions.
CI/CD Pipelines and Build Artifacts
Continuous integration runners in platforms like GitHub Actions or self-hosted GitLab runners accumulate heavy caches from package managers (npm, pip, Maven, Gradle) and temporary build artifacts. Pipeline scripts should incorporate clean-up steps or utilize ephemeral runner environments to prevent successive builds from failing due to exhausted disk space on the build node.
Common Mistakes and Troubleshooting
Even experienced developers encounter subtle pitfalls when analyzing Linux storage. Recognizing these common mistakes prevents incorrect assumptions and potential data loss.
Deleted Files Held by Open Processes
A frequent conundrum occurs when df reports that a partition is completely full, but du run on the root directory shows plenty of free space. This discrepancy happens when a file is deleted by an application while a running process still holds an open file descriptor to it. The Linux kernel keeps the file blocks allocated on disk until the process releases them or terminates.
To identify these invisible space hogs, run lsof filtered for deleted files:
sudo lsof +L1
Expected output lists the offending process ID (PID), user, file descriptor, and file size. Restarting the associated service safely releases the file descriptors and reclaims the storage space without requiring a system reboot.
Misinterpreting Block Sizes and Sparse Files
Another common mistake involves sparse files—files that contain sequences of zero bytes allocated by the filesystem only when written to. Tools like du might report a sparse file's apparent size rather than its actual disk consumption unless specific flags are used. Always verify command flags against local man pages to ensure accurate reporting for specialized storage configurations.
Best Practices for Storage Monitoring
Maintaining healthy storage infrastructure requires moving from reactive firefighting to proactive management. Implementing standardized practices ensures high availability across development and production environments.
Setting Up Alerting Thresholds
Configure automated monitoring alerts—via Prometheus Alertmanager, Nagios, or cloud provider monitoring tools—to trigger warning notifications when filesystem utilization crosses 80% and critical alerts at 90%. This buffer gives engineering teams sufficient time to investigate and remediate before services experience failure.
Implementing Automated Log Rotation
Unmonitored text logs written to /var/log are among the most common causes of unexpected disk exhaustion. Ensure logrotate is configured correctly across all Linux distributions, setting appropriate retention windows, compression, and maximum file sizes for application and system logs.
Periodic Cleanup Audits
Establish scheduled routines for pruning unused Docker resources, clearing stale temporary directories in /tmp and /var/tmp, and purging old kernel versions on servers that retain multiple historical boot images. Regular maintenance safeguards system stability and predictable performance.
📌 Recommended Next Guides & References
  <li>
    <a href="/article/docker-and-kubernetes-how-they-work-together-2" class="text-primary hover:underline font-semibold flex items-center gap-2">
      <span>→</span> <span>Docker and Kubernetes: How They Work Together</span>
    </a>
  </li>

  <li>
    <a href="/article/kubernetes-ingress-explained" class="text-primary hover:underline font-semibold flex items-center gap-2">
      <span>→</span> <span>Kubernetes Ingress Explained: Routing, Controllers, and TLS</span>
    </a>
  </li>

  <li>
    <a href="/article/kubernetes-ingress-controller-explained" class="text-primary hover:underline font-semibold flex items-center gap-2">
      <span>→</span> <span>Kubernetes Ingress Controller Explained: Architecture, Routing, and Implementation</span>
    </a>
  </li>