Quick Answer
Linux processes form the absolute bedrock of every GNU/Linux operating system. Whether you are running a monolithic database server, compiling software inside a local terminal, managing microservices in Docker containers, or orchestrating deployments via Kubernetes, every single executing program on your system is managed as one or more processes. Understanding how the kernel creates, schedules, monitors, and terminates processes is an essential competency for any developer, systems administrator, or DevOps practitioner. Without a firm grasp of process mechanics, diagnosing performance bottlenecks, memory leaks, runaway CPU loops, or unexpected container exits becomes an exercise in guesswork.
Quick Answer: What Are Linux Processes?
A Linux process is an instance of an executing program. When you run a command, script, or binary, the Linux kernel allocates a dedicated address space, memory, security context, and system resources for it. Every process is uniquely identified by a positive integer called a Process ID, or PID. PIDs are assigned sequentially by the kernel until they reach a maximum threshold, at which point they wrap around and reuse available lower integers. Processes do not exist in isolation; they are organized in a strict hierarchical tree structure. Every process except the very first one has a parent process from which it was spawned, creating parent-child relationships that dictate ownership, resource limits, and signal propagation across the system.
Understanding Linux Processes and Lifecycle
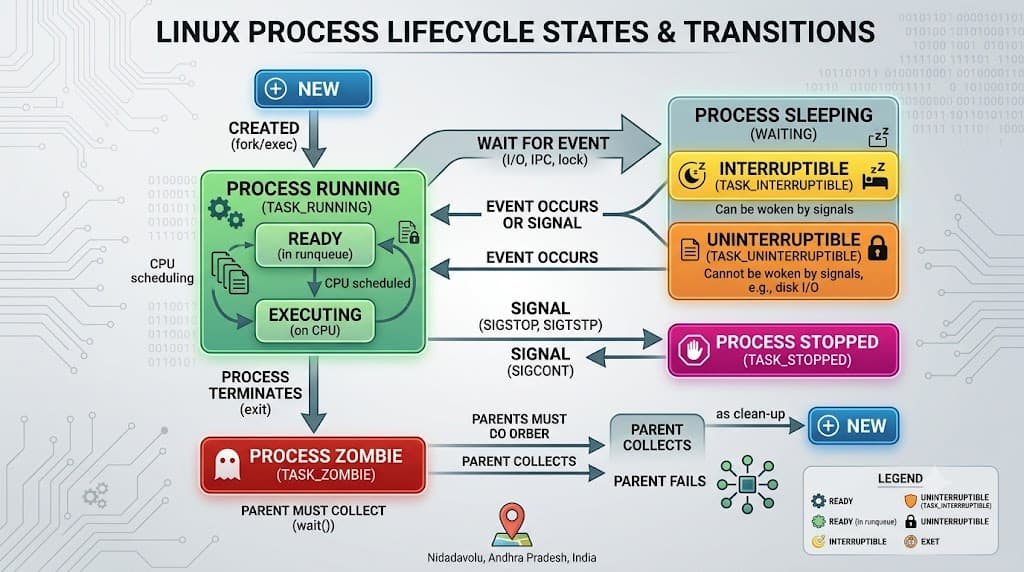
The lifecycle of a Linux process is a meticulously managed choreography handled entirely by the kernel scheduler and process management subsystems. When a new application needs to start, a parent process typically uses a system call combination known as fork() and exec(). The fork() system call duplicates the existing calling process, creating an exact child clone with its own unique PID and its own memory page allocations. Immediately following the fork(), the exec() system call replaces the duplicated memory space with the new program binary, loading its code, initializing its stack, and beginning execution from its entry point.
During its lifetime, a Linux process traverses several distinct states managed by the kernel scheduler:
- Running or Runnable: The process is either currently executing on a CPU core or sitting in the kernel run queue waiting for its allocated CPU time slice.
- Interruptible Sleep: The process is blocked, waiting for a specific external event to occur, such as user input from a terminal, network packets arriving on a socket, or disk I/O operations to complete. It can be prematurely awakened by incoming signals.
- Uninterruptible Sleep: The process is waiting directly on hardware or low-level kernel conditions that cannot be interrupted by signals. These processes are typically stuck waiting for unresponsive storage devices or NFS mounts and cannot be killed normally until the underlying hardware condition resolves.
- Stopped: The process has been explicitly paused by receiving a stop signal, such as SIGSTOP or SIGTSTP (often triggered via Ctrl+Z in an interactive shell).
- Zombie: A terminated process whose execution has finished, but whose exit status has not yet been read by its parent process via wait(). The process descriptor remains in the process table to preserve its exit code.
Understanding these states is vital for developers debugging hanging deployment scripts or sluggish backend services. A proliferation of uninterruptible sleep states points directly to storage or network subsystem degradation, whereas zombie processes indicate buggy parent processes failing to collect child exit statuses.
Core Process Management Commands
Inspecting and managing system state requires familiarity with standard command line utilities. The Linux command line offers a rich suite of built-in and package-managed tools designed to reveal process trees, resource consumption, and execution states.
The ps command is the primary utility for inspecting a static snapshot of currently running processes. By default, running bare ps displays only processes associated with your current shell session. To gain a comprehensive view of the entire system, developers combine standard BSD or UNIX flag sets:
ps aux
The aux flag combination instructs ps to display processes belonging to all users (a), format the output with detailed user and ownership information (u), and include daemon processes not attached to any terminal device (x). The output columns provide critical insights: USER shows the process owner, PID identifies the process ID, %CPU and %MEM show instantaneous resource consumption, VSZ and RSS detail virtual and resident memory usage, STAT reveals the current process state flags, and START/TIME show launch timing and accumulated CPU time.
When you need to filter the output for a specific application—such as finding a runaway Node.js process—piping ps into grep is a common developer workflow:
ps aux | grep node
For real-time monitoring and dynamic inspection, the top command provides an interactive, updating dashboard of system performance and active tasks. Invoking top opens a full-screen text interface displaying overall CPU utilization, memory and swap usage, and an ordered list of processes sorted by default according to CPU usage. Within top, you can press specific interactive keys: 'k' to instantly prompt for a PID and send a kill signal, 'u' to filter processes by a specific username, or 'M' to re-sort the process list by memory consumption instead of CPU.
For developers seeking a more modern, color-coded, and mouse-friendly alternative, htop offers an enriched visual interface featuring vertical meters for CPU and memory cores, process tree views, and direct interactive mouse support for scrolling and signaling processes.
When working inside an interactive terminal, job control commands like jobs, fg, and bg become indispensable. When you launch a background task by appending an ampersand to your command:
sleep 300 &
The shell assigns it a job ID and runs it concurrently. Typing the jobs command lists all background and stopped jobs currently managed by your shell session, allowing you to bring them back to the foreground using fg %1 or resume them in the background using bg %1.
Controlling Processes with Signals
Signals are asynchronous notifications sent by the kernel to a process to inform it of an event or request an action. They act as the primary mechanism for inter-process communication and process control.
When a process receives a signal, it can take one of three actions: ignore the signal completely, execute a custom signal handler function defined by the application developer, or perform the default kernel action (which is usually terminating the process or dumping core memory).
Here are the most important signals every developer and DevOps engineer must know:
- SIGTERM (Signal 15): The polite termination signal. It requests that a process gracefully save its state, close open database connections, flush buffers, and exit cleanly. This is the default signal sent by the kill command.
- SIGKILL (Signal 9): The absolute, uncatchable termination signal. It is delivered directly to the kernel, which immediately halts the process without giving it any opportunity to execute cleanup handlers or save state.
- SIGHUP (Signal 1): The hangup signal. Originally used to signal a dropped modem connection, it is commonly re-purposed by modern daemons (like Nginx or systemd services) as a command to reload their configuration files without dropping active client connections.
- SIGSTOP / SIGCONT: Signals used to pause and resume process execution respectively.
To send a signal to a process, use the kill command followed by the target PID:
kill 1422
By default, this sends SIGTERM. If a misbehaving application ignores SIGTERM or hangs in an infinite loop, you can escalate to SIGKILL by explicitly specifying the signal flag:
kill -9 1422
Always verify that you are targeting the correct PID before executing termination commands, especially in production environments. You can verify process termination immediately afterward by checking if the PID remains in the process table:
ps -p 1422
If the command returns no output and a non-zero exit status, the process has successfully terminated and been reaped by the system.
Common Mistakes and Safe Verification
Process management carries inherent risks, particularly when executed with elevated root privileges. Recognizing common pitfalls prevents accidental outages and data corruption.
A frequent mistake among inexperienced administrators is reaching immediately for kill -9 on every unresponsive application. While SIGKILL forces a process to disappear instantly, it bypasses all application cleanup routines. For database servers, application runtimes, and caching layers, abrupt termination can corrupt transaction logs, leave lock files dangling, or orphan shared memory segments. Always attempt a graceful SIGTERM first and allow the application a reasonable timeout window to shut down before escalating.
Another common misconception involves misinterpreting zombie processes. Developers frequently panic upon seeing 'Z' state processes in ps aux output, assuming a severe system leak. However, zombie processes consume zero CPU and zero active memory; they are merely dead entry slots waiting for their parent process to call wait(). If the parent process is a long-running daemon that fails to reap its children, the correct remediation is to restart or fix the parent process, not to hunt down individual zombie PIDs.
Destructive commands such as killall, pkill, or mass termination loops must be handled with extreme care. Running a broad pattern match against process names can inadvertently terminate critical system daemons, SSH daemons, or monitoring agents, locking you out of the server.
Safe verification involves checking dry-run patterns or targeting precise PIDs. For instance, before terminating processes matching a name, inspect them safely using pgrep:
pgrep -l -f worker-process
This command lists matching PIDs and their full command arguments without executing any destructive action, ensuring your targeting is precise before issuing any management commands.
Troubleshooting and DevOps Context
In modern software engineering, Linux process architecture extends far beyond bare-metal servers into containerized and automated delivery pipelines.
When deploying applications inside Docker containers, process management takes on unique characteristics. By default, when you run a container, Docker executes your primary command as PID 1 inside the container's isolated mount and process namespace. This introduces a critical operational gotcha: PID 1 in Linux has special responsibilities. Unlike normal processes, PID 1 does not inherit default signal handlers from the kernel. If your container entrypoint is a shell script or an interpreted runtime that does not explicitly forward signals (SIGTERM) to child application processes, pressing stop or running docker stop will cause Docker to wait for a 10-second timeout before forcibly killing your container with SIGKILL. This can result in dropped requests and corrupt database writes during rolling deployments.
To solve this, container authors use specialized init systems like Tini or proper entrypoint wrappers as PID 1 to ensure signals are correctly propagated down to worker processes.
In Kubernetes environments, process management intersects directly with container resource limits and cgroups. If a Java application or Node.js service inside a Kubernetes pod exceeds its container memory limit defined in the resource manifest, the Linux kernel's Out-Of-Memory (OOM) killer steps in asynchronously. The OOM killer evaluates process memory footprints, calculates an oom_score, and abruptly terminates the offending process with zero warning. Developers troubleshooting mysterious container crashes in Kubernetes clusters must inspect kernel logs using dmesg or journalctl to confirm whether an OOM killer event occurred:
dmesg -T | grep -i oom
Finally, in CI/CD pipelines running on runners in GitHub Actions, GitLab CI, or Jenkins, runaway background build steps, lingering test runners, or un-terminated test servers can pollute runner nodes. Proper CI/CD job isolation ensures that lingering processes spawned during test suites are cleaned up post-build, preventing resource exhaustion across subsequent pipeline runs. Using job control, proper signal handling in shell step definitions, and robust timeout configurations ensures resilient and predictable automation workflows.
📌 Recommended Next Guides & References
  <li>
    <a href="/article/docker-and-kubernetes-how-they-work-together-2" class="text-primary hover:underline font-semibold flex items-center gap-2">
      <span>→</span> <span>Docker and Kubernetes: How They Work Together</span>
    </a>
  </li>

  <li>
    <a href="/article/kubernetes-ingress-explained" class="text-primary hover:underline font-semibold flex items-center gap-2">
      <span>→</span> <span>Kubernetes Ingress Explained: Routing, Controllers, and TLS</span>
    </a>
  </li>

  <li>
    <a href="/article/kubernetes-ingress-controller-explained" class="text-primary hover:underline font-semibold flex items-center gap-2">
      <span>→</span> <span>Kubernetes Ingress Controller Explained: Architecture, Routing, and Implementation</span>
    </a>
  </li>