Quick Answer
Quick Answer
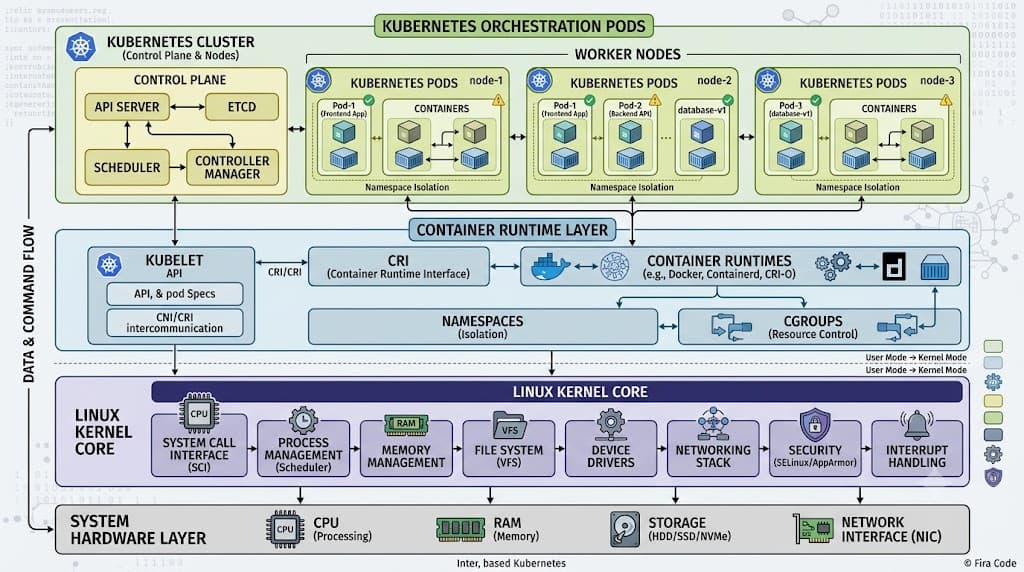
Kubernetes commands—executed primarily via the kubectl command-line utility—are essential tools for interacting with clusters, deploying applications, inspecting cluster state, and troubleshooting containerized workloads. To manage resources effectively, administrators and developers rely on kubectl to translate human intents into declarative API calls accepted by the Kubernetes API server. The most effective way to start is by verifying cluster connectivity with kubectl cluster-info and exploring running pods using kubectl get pods --all-namespaces. Mastering these tools bridges the gap between raw YAML configuration files and reliable production-grade container orchestration.
Command Categories
To navigate the vast ecosystem of kubectl operations efficiently, administrators group commands into distinct logical categories based on their operational lifecycle stage. Understanding these categories prevents accidental misconfigurations and streamlines daily engineering workflows.
- Read & Inspection: Non-destructive operations designed to query state, view configurations, and examine system metrics without altering cluster resources (
kubectl get,kubectl describe,kubectl top). - Creation & Application: Imperative and declarative workflows that push resource configurations into the cluster, establishing desired states (
kubectl apply,kubectl create,kubectl replace). - Debugging & Diagnostics: Interactive utilities focused on troubleshooting live runtimes, streaming console output, and opening ephemeral shells inside containers (
kubectl logs,kubectl exec,kubectl debug,kubectl port-forward). - Lifecycle Management: Administrative commands that handle scaling, rolling updates, rollbacks, and safe resource termination (
kubectl scale,kubectl rollout,kubectl delete). - Cluster & Context Management: Configuration commands that manage authentication tokens, context switches, multiple cluster endpoints, and user credentials (
kubectl config).
By categorizing these operations, engineers can quickly recall the precise verb needed for a given task, whether they are debugging an unready pod or performing a zero-downtime application upgrade in a production cluster.
Inspect Resources
Inspecting cluster resources is the most frequent activity performed by developers and DevOps engineers during daily operations. Before modifying any deployment, you must accurately determine the current state of your nodes, pods, services, and persistent volumes. The Kubernetes API exposes rich metadata for every object, and learning how to filter, format, and extract this data is critical for maintaining high availability.
kubectl get
The kubectl get command is your primary utility for listing one or more resources across namespaces. It offers versatile filtering and output formatting capabilities that make it indispensable for scripting and quick status checks.
Commonly used flags and options include:
-n <namespace>: Targets a specific namespace instead of the default namespace.-Aor--all-namespaces: Queries resources across every namespace in the cluster.-o wide: Displays additional columns, such as node assignment and IP addresses.-o yamlor-o json: Dumps the full object specification and status in structured formats for deep inspection or piping to tools likegrepandjq.--watchor-w: Streams live updates as resource states change in real time.
For example, to list all pods in the production namespace along with their assigned nodes and internal IP addresses, run:
kubectl get pods -n production -o wide
To continuously watch the status of a specific deployment during a rollout, use:
kubectl get deployment web-server -n production --watch
When working with custom resource definitions (CRDs), kubectl get seamlessly queries those custom types just like native Kubernetes objects, provided the correct plural name or shorthand is specified.
kubectl describe
While kubectl get provides a high-level tabular summary, kubectl describe dives deep into a single resource's detailed status, specifications, and associated event history. This makes it the go-to command when a pod fails to start or a service refuses to route traffic.
When you execute kubectl describe, the output is divided into logical sections:
- Metadata: Labels, annotations, namespace, creation timestamps, and unique resource UIDs.
- Spec: The declared configuration requirements, such as container image tags, resource limits, environment variables, volume mounts, and restart policies.
- Status: The current runtime phase, container start states, IP allocations, and readiness/liveness probe outcomes.
- Events: A chronological audit trail generated by the kubelet and scheduler, detailing scheduling decisions, image pull progress, and runtime failure alerts.
The event log at the bottom of a kubectl describe output is often the fastest way to diagnose common container startup blockers, such as ImagePullBackOff, CrashLoopBackOff, or insufficient node CPU and memory allocations. For example, to inspect a failing pod named api-gateway-7d8b9 in the staging namespace, execute:
kubectl describe pod api-gateway-7d8b9 -n staging
Reviewing these events helps you bypass guesswork and pinpoint exact infrastructure or configuration bottlenecks immediately.
Create and Apply Resources
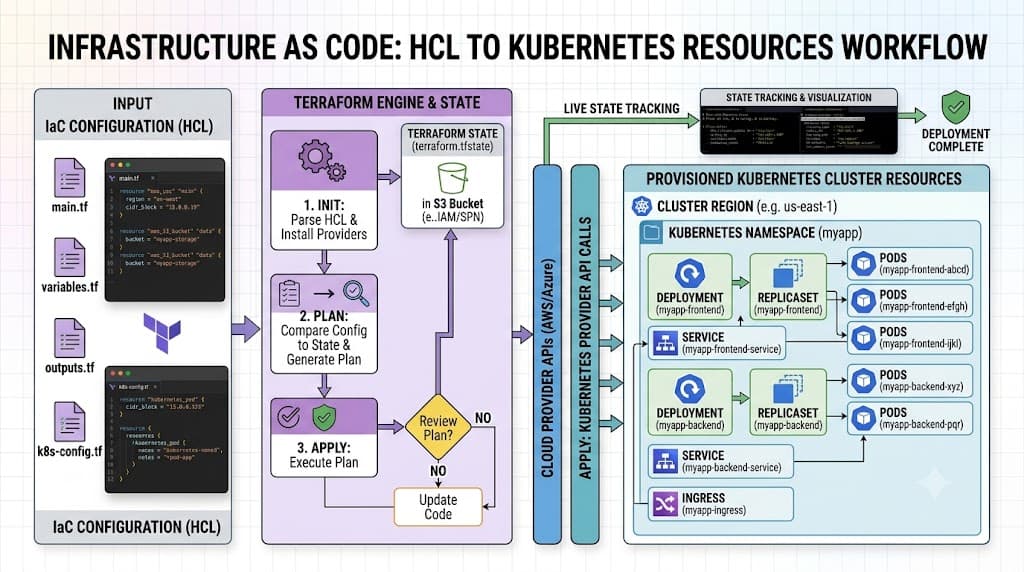
Managing resource lifecycles requires choosing between imperative commands (telling Kubernetes exactly what commands to run) and declarative configurations (describing the desired state in YAML files and letting Kubernetes reconcile the differences). While imperative commands like kubectl run are useful for quick testing, production environments rely heavily on declarative workflows.
kubectl apply
kubectl apply is the cornerstone of declarative Kubernetes management. It reads configuration files—either individual YAML manifests or entire directories—and applies the desired state to the cluster. If a resource does not exist, kubectl apply creates it. If it already exists, kubectl apply performs a smart patch, updating only the fields that have changed while preserving fields managed by other controllers or autoscalers.
To apply a single configuration manifest, run:
kubectl apply -f deployment.yaml
To recursively apply all YAML files located within a specific directory and its subdirectories, use the recursive flag:
kubectl apply -f ./manifests/ --recursive
One common failure mode when using kubectl apply is encountering conflicts due to out-of-band modifications made via imperative commands (such as kubectl edit or kubectl scale). When multiple actors modify the same resource configuration without a unified source of truth, kubectl apply may warn you about annotation drift or reject the update to prevent overwriting critical changes. To mitigate this, maintain all production manifests in a Git repository and treat version-controlled files as the absolute source of truth.
Logs and Debugging
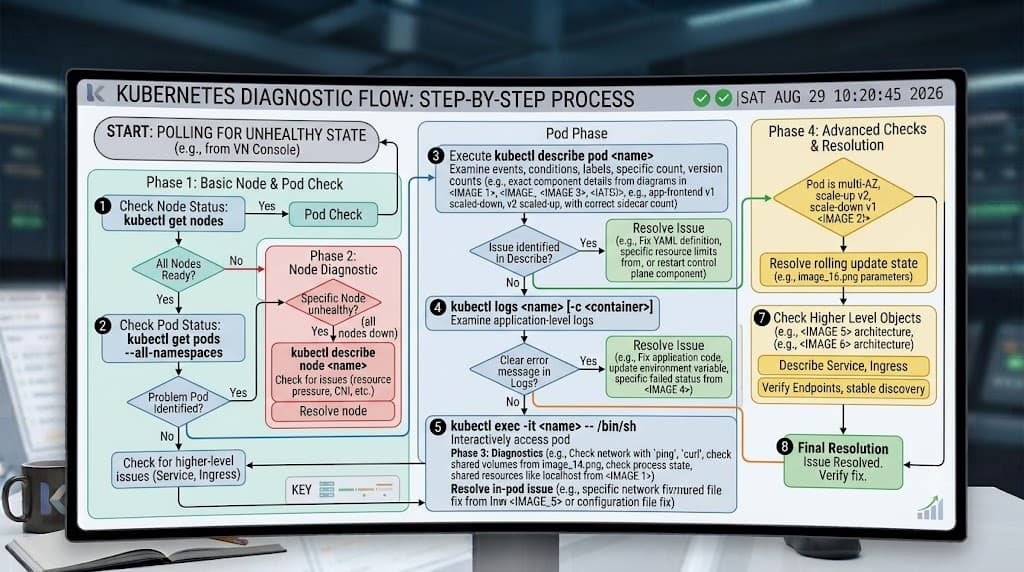
When applications behave unexpectedly in production, developers must examine runtime logs and inspect container internals directly. Kubernetes provides robust commands to stream container output and execute interactive troubleshooting sessions.
kubectl logs
The kubectl logs command retrieves standard output (stdout) and standard error (stderr) streams from containers running inside a pod. Because pods frequently contain multiple containers (such as application containers alongside sidecar proxies or logging agents), specifying the container name is often necessary.
Key flags for kubectl logs include:
-for--follow: Streams log output continuously in real time, similar to the Unixtail -fcommand.--tail=<number>: Limits the output to the most recent specified number of lines.--previous: Retrieves logs from a previous, crashed instance of a container, which is invaluable for debugging intermittent startup failures.-c <container-name>: Targets a specific container within a multi-container pod.
For example, to stream live logs from a container named payment-service running inside a specific pod, execute:
kubectl logs payment-service-pod-xyz -c payment-service -f
If a pod recently crashed due to an unhandled exception, you can examine the exit cause by running:
kubectl logs payment-service-pod-xyz -c payment-service --previous
kubectl exec
When log analysis alone is insufficient, kubectl exec allows you to run interactive shell commands inside a running container. This is extremely useful for verifying network connectivity, inspecting local file systems, checking environment variables, or testing internal DNS resolution.
To open an interactive Bash or Sh shell session inside a container, combine the -it flags (interactive and terminal allocation):
kubectl exec -it frontend-pod-abc -- /bin/sh
Safety Warning: Executing interactive shells inside production containers should be performed with extreme caution. Avoid modifying files directly inside a running container, as these changes are ephemeral and will be lost immediately when the pod restarts or reschedules. Furthermore, hardened minimal container images (such as distroless or scratch images) intentionally omit shells and package managers for security reasons; attempting kubectl exec on these images will fail because binaries like /bin/sh or /bin/bash do not exist within the container file system.
Scaling and Rollouts
Applications experience fluctuating traffic loads that require dynamic capacity adjustments, as well as frequent code updates that demand safe deployment strategies.
To adjust the number of replicas for a deployment imperatively, use kubectl scale:
kubectl scale deployment/web-frontend --replicas=5 -n production
For managing application updates without downtime, kubectl rollout provides complete control over version transitions. You can inspect the history of a deployment to verify which revisions were applied:
kubectl rollout history deployment/web-frontend -n production
If a newly deployed version introduces critical bugs, you can instantly revert to the previous stable revision using:
kubectl rollout undo deployment/web-frontend -n production
Monitoring the rollout status in real time ensures that traffic is only routed to new pods after their readiness probes pass successfully:
kubectl rollout status deployment/web-frontend -n production
Delete Safely
Deleting resources from a Kubernetes cluster is a permanent operation that requires careful planning to prevent accidental outages. By default, kubectl delete initiates a graceful termination process, allowing applications active connections to drain before the container processes are forcefully terminated.
To delete a resource using its configuration file, run:
kubectl delete -f deployment.yaml
To delete a specific resource by type and name while enforcing a custom grace period (e.g., 30 seconds), use:
kubectl delete pod leaky-pod-123 --grace-period=30
In emergency scenarios where a pod hangs during termination due to stuck finalizers or unresponsive processes, you can bypass the graceful shutdown period and force immediate deletion by setting the grace period to zero:
kubectl delete pod hung-pod-456 --grace-period=0 --force
Common Mistake: Omitting the namespace flag (-n) when deleting resources is a frequent error that can result in deleting objects from the default namespace rather than your intended target. Always double-check your target namespace or configure your current context explicitly using kubectl config set-context --current --namespace=<name> before executing deletion commands.
📌 Recommended Next Guides & References
  <li>
    <a href="/article/docker-and-kubernetes-how-they-work-together-2" class="text-primary hover:underline font-semibold flex items-center gap-2">
      <span>→</span> <span>Docker and Kubernetes: How They Work Together</span>
    </a>
  </li>

  <li>
    <a href="/article/kubernetes-ingress-explained" class="text-primary hover:underline font-semibold flex items-center gap-2">
      <span>→</span> <span>Kubernetes Ingress Explained: Routing, Controllers, and TLS</span>
    </a>
  </li>

  <li>
    <a href="/article/kubernetes-ingress-controller-explained" class="text-primary hover:underline font-semibold flex items-center gap-2">
      <span>→</span> <span>Kubernetes Ingress Controller Explained: Architecture, Routing, and Implementation</span>
    </a>
  </li>