Quick Answer
A kubernetes cluster is a set of node machines, consisting of worker machines and a control plane, that run containerized applications. Managing containerized workloads at scale requires more than just a container runtime; it demands a resilient orchestration framework that automates deployment, scaling, networking, and fault recovery. Understanding a kubernetes cluster requires looking at how disparate servers are bound together into a single, cohesive distributed system. Whether you are running a local development environment or a multi-region production footprint, mastering cluster anatomy forms the foundation of modern cloud-native engineering. This guide examines the fundamental architecture, operational lifecycle, and maintenance commands required to run robust containerized systems. When planning your cluster strategy, remember that sizing decisions depend heavily on your specific workload profiles, throughput requirements, and high-availability objectives rather than rigid universal formulas. By examining both control plane mechanics and worker node operations, you can design, troubleshoot, and optimize your distributed infrastructure effectively.
Quick Answer
A kubernetes cluster is a managed group of physical or virtual machines—known as nodes—that work together to execute and scale containerized applications. The cluster consists of a control plane that maintains the desired state of the system and worker nodes that actually host and run the container workloads inside pods. To verify that your cluster is operational and inspect the available nodes, administrators typically run the command kubectl get nodes. Proper cluster management involves understanding how pods are scheduled, how networking bridges containers across hosts, and how resource limits protect system stability.
What a Kubernetes Cluster Is
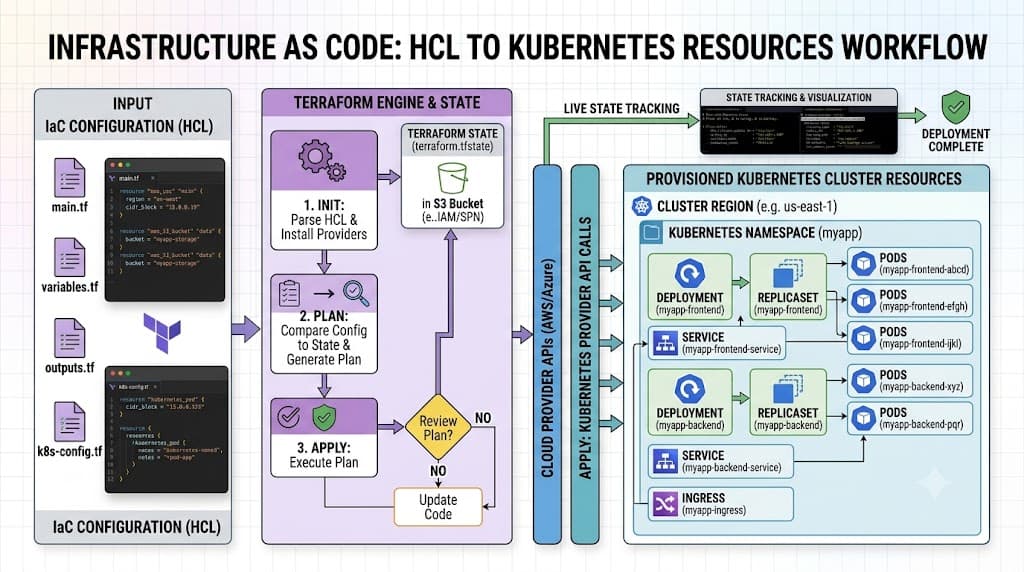
At its core, a kubernetes cluster represents a shift from treating individual servers as pets to managing a pool of compute resources as a single unified platform. The foundational role of the kubernetes architecture is to abstract away underlying infrastructure details, allowing developers and operators to declare the desired state of their applications rather than manually orchestrating container lifecycles across specific operating systems or hypervisors. A cluster bridges physical or cloud-hosted infrastructure with software-defined networking and storage subsystems.
When you deploy an application into a kubernetes cluster, you do not tell the system which specific server to use. Instead, you submit configuration manifests that define containers, storage volumes, environment variables, and resource boundaries. The cluster's internal control loops constantly compare this declared desired state against the actual observed state of the environment. If a worker node experiences a hardware failure, the cluster detects the discrepancy and automatically reschedules the affected workloads onto healthy remaining nodes. This self-healing property makes distributed systems significantly more resilient against transient infrastructure failures than traditional deployment models.
Furthermore, cluster anatomy separates concerns cleanly between control mechanisms and application execution. This separation ensures that management traffic and operational telemetry do not interfere directly with user-facing application traffic. Understanding this architectural division is essential for troubleshooting performance bottlenecks, planning capacity upgrades, and securing production environments against unauthorized access.
Control Plane and Nodes
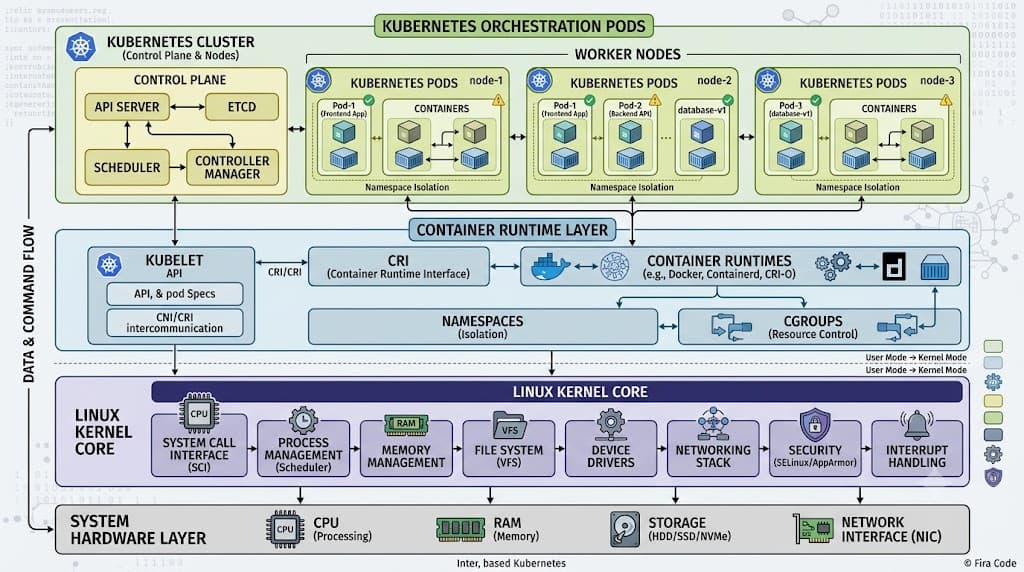
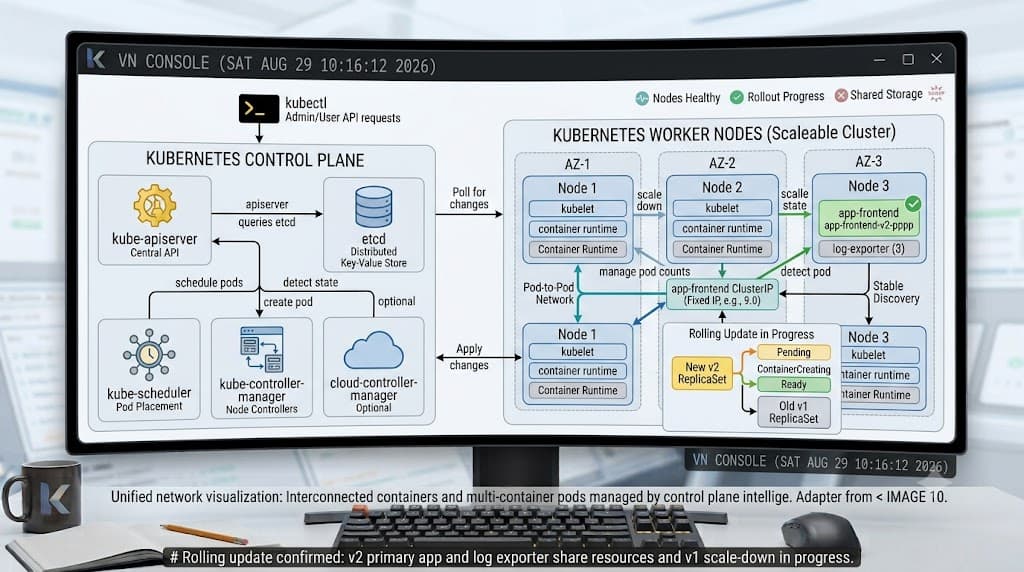
The architecture of a kubernetes cluster divides responsibility between two primary layers: the control plane and the worker nodes. The kubernetes control plane acts as the brain of the system, making global decisions about the cluster, detecting events, and responding to changes. It comprises several critical components that run continuously. The API server exposes the Kubernetes API and serves as the front door for all management interactions, handling requests from CLI tools like kubectl, user interfaces, and controllers. The etcd datastore is a consistent and highly available key-value store used as the backing store for all cluster data, maintaining the complete state of the cluster over time.
Beneath the API server, the kube-scheduler watches for newly created pods with no assigned node and selects an optimal worker node for them to run on based on resource availability, affinity rules, and taint tolerances. The controller manager runs background control loops—such as the node controller, endpoint controller, and replication controller—which continuously strive to move the current cluster state closer to the desired state. Finally, the cloud-controller-manager integrates the cluster with underlying cloud provider APIs, managing tasks like load balancer provisioning, node lifecycle hooks, and cloud storage volumes.
Worker nodes, on the other hand, are the worker bees of the cluster. A kubernetes node can be a virtual machine or a physical bare-metal server equipped with a container runtime, a kubelet, and a kube-proxy. The kubelet is the primary node agent that registers the node with the cluster, ensures that containers described in pod specs are running and healthy, and reports node status back to the control plane. The container runtime—such as containerd or CRI-O—is responsible for pulling container images from registries, unpacking them, and executing the containers in isolated namespaces and cgroups. Meanwhile, kube-proxy maintains network rules on each node, enabling network communication to your pods from network sessions inside or outside of your cluster by handling low-level packet forwarding and TCP/UDP stream routing.
Scheduling Workloads
Once your cluster infrastructure is up and running, the next challenge is managing how workloads are deployed and executed. In Kubernetes, the atomic unit of scheduling is not the container directly, but rather kubernetes pods. A pod represents a single instance of a running process in your cluster and can encapsulate one or more tightly coupled containers that share storage, network namespaces, and operational lifecycles. For instance, a pod might contain a primary web application container alongside a sidecar container responsible for log aggregation or metrics collection.
Workload scheduling follows a deliberate multi-step lifecycle. When a user or CI/CD pipeline submits a pod manifest via kubectl apply, the API server validates the configuration and persists it in etcd. The scheduler then intercepts the unassigned pod, evaluates available cluster resources, applies filtering predicates (such as matching node selectors or resource requests), and prioritizes candidate nodes. Once a target node is selected, the scheduler writes a binding object back to the API server.
Upon detecting the new assignment, the kubelet on the target node pulls the required container images and instructs the container runtime to launch the pod's containers. Throughout the workload's lifetime, liveness and readiness probes configured in the pod manifest monitor application health. If an application crashes or fails its liveness check, the kubelet restarts the container locally, while higher-level controllers like deployments ensure that replica counts remain consistent even if an entire node goes offline unexpectedly.
Networking
See also: Kubernetes networking model
Networking in a kubernetes cluster is uniquely challenging because containers, pods, and nodes must communicate seamlessly without relying on brittle port-mapping configurations. The core Kubernetes networking model establishes flat, cluster-wide connectivity adhering to specific fundamental rules: every pod gets its own unique IP address, pods on any node can communicate with all pods on all other nodes without using Network Address Translation (NAT), and the IP that a pod sees as its own address is the same IP that every other pod sees it as.
To achieve this flat routing model without building monolithic switching logic into core Kubernetes, the ecosystem relies on Container Network Interface (CNI) plugins. Popular CNI implementations such as Calico, Cilium, Flannel, and Flannel-alternative overlays configure virtual ethernet interfaces, routing tables, or eBPF maps to bridge traffic between pods. When Pod A wants to talk to Pod B, packets flow directly through the CNI-managed fabric without hairpinning through the host.
Beyond pod-to-pod communication, services abstract pod IP ephemerality. Because pods are transient and frequently destroyed or recreated during scaling events and deployments, direct IP addressing is impractical for consumer applications. Kubernetes Services provide stable IP addresses, DNS names, and load balancing across a dynamic set of backend pods. Types of services include ClusterIP (internal-only access), NodePort (exposing services on static ports across all nodes), and LoadBalancer (provisioning external cloud load balancers), ensuring that inbound traffic reaches healthy pods reliably.
Scaling and Availability
Production systems must handle fluctuating traffic loads and resist localized infrastructure failures. A kubernetes cluster addresses these requirements through horizontal scaling and robust High Availability (HA) design patterns. Horizontal scaling allows you to increase or decrease the number of pod replicas running in your cluster based on resource utilization metrics using the Horizontal Pod Autoscaler (HPA), or scale the underlying node pool using cluster autoscalers when resource requests exceed current capacity.
Achieving true High Availability at the cluster layer requires redundancy across critical control plane components. In a production-grade production setup, the control plane is distributed across at least three or five availability zones or physical servers, ensuring that etcd maintains quorum even if an entire rack or cloud data center experiences an outage. Worker nodes should likewise be distributed across multiple failure domains to prevent regional outages from taking down entire application tiers.
When planning cluster capacity, always avoid prescribing a universal node count. System requirements depend entirely on your application's CPU and memory footprints, expected request concurrency, storage I/O profiles, and target availability SLAs. Over-provisioning wastes costly cloud compute credits, while under-provisioning leads to CPU throttling, out-of-memory (OOM) kills, and cascading application failures. Careful monitoring, load testing, and right-sizing resource requests and limits in pod specifications are vital steps in maintaining a stable, cost-effective cluster.
Local vs Managed Clusters
Before deploying production workloads, engineers must decide where and how to run their clusters. The choice generally splits between setting up local clusters for development and testing versus consuming fully managed cloud Kubernetes services for production workloads. Local clusters—built using tools like Minikube, Kind (Kubernetes in Docker), or Docker Desktop's built-in Kubernetes engine—allow developers to run single-node or multi-node clusters directly on their local workstation. These environments are lightweight, fast to spin up, and cost-free, making them ideal for rapid iteration, debugging manifests, and learning Kubernetes concepts without incurring cloud bills.
Conversely, enterprise production environments almost universally rely on managed Kubernetes offerings provided by major cloud vendors, such as Amazon EKS, Google GKE, and Azure AKS. In a managed cluster, the cloud provider assumes operational responsibility for maintaining, patching, and securing the control plane infrastructure, including etcd backups and API server scaling. This frees platform engineering teams to focus exclusively on application deployment, CI/CD pipelines, security compliance, and developer enablement rather than spending operational hours wrestling with control plane upgrades and certificate expirations.
However, managed clusters still require careful configuration regarding node group management, IAM permissions, network security policies, and cost governance. Choosing between local and managed setups depends heavily on your project phase, budget, and operational maturity. Combining local development workflows with automated, managed staging and production clusters provides the most reliable pathway from initial code commit to resilient production delivery.
kubectl get nodes
Inspecting cluster node health and operational status is a daily task for cluster administrators. The primary command used for this purpose is kubectl get nodes. Executing this command queries the API server and returns a tabular list of all worker and control plane nodes registered to the cluster. Key output columns typically include the node name, current status (such as Ready or NotReady), role designation, node age, and the exact version of the Kubernetes kubelet running on that host. When troubleshooting cluster scheduling failures, checking node status is the first diagnostic step. If a node displays a NotReady status, it usually indicates that the kubelet has stopped reporting heartbeat telemetry to the control plane due to network partitioning, high CPU starvation, or container runtime failure. Administrators often append the -o wide flag to this command to reveal additional diagnostic details, including internal and external IP addresses, operating system kernels, container runtime versions, and architecture types across your node fleet.
kubectl get pods -A
When managing complex microservice architectures distributed across multiple namespaces, gaining visibility into application states requires cluster-wide inspection. The command kubectl get pods -A (where -A is shorthand for --all-namespaces) instructs the API server to list every single pod running across every namespace in the cluster. This comprehensive view includes system pods residing in kube-system, ingress controllers, monitoring agents, and all user-facing application workloads. The output displays the namespace, pod name, current restart count, status (such as Running, Pending, CrashLoopBackOff, or Terminating), and uptime. Using this command during incident response allows operators to quickly identify failing pods, rogue resource consumers, or stalled initialization sequences cluster-wide without needing to query individual namespaces manually. It serves as an indispensable health check tool for validating that background daemons and application deployments are reconciling correctly after configuration changes or rolling updates.
kubectl describe node
When a specific node in your cluster exhibits resource exhaustion or scheduling anomalies, running kubectl describe node <node-name> provides a comprehensive, granular inspection of that host. Unlike simple list commands, this verbose diagnostic command outputs detailed metadata, system capacities, allocated resource percentages, active taints and tolerations, hardware conditions, and a real-time table of all pods currently scheduled onto that node along with their precise CPU and memory requests. Administrators examine the Conditions section of the output to verify whether the node is experiencing memory pressure (MemoryPressure), disk pressure (DiskPressure), or PID exhaustion (PIDPressure), all of which will prevent the scheduler from placing new workloads onto the host. Additionally, reviewing the allocated resources section helps identify whether node capacity has been fully claimed by existing reservations, explaining why newly deployed pods remain stuck in a Pending state. This deep dive connects high-level cluster architecture directly to concrete host-level troubleshooting.
📌 Recommended Next Guides & References
  <li>
    <a href="/article/docker-and-kubernetes-how-they-work-together-2" class="text-primary hover:underline font-semibold flex items-center gap-2">
      <span>→</span> <span>Docker and Kubernetes: How They Work Together</span>
    </a>
  </li>

  <li>
    <a href="/article/kubernetes-ingress-explained" class="text-primary hover:underline font-semibold flex items-center gap-2">
      <span>→</span> <span>Kubernetes Ingress Explained: Routing, Controllers, and TLS</span>
    </a>
  </li>

  <li>
    <a href="/article/kubernetes-ingress-controller-explained" class="text-primary hover:underline font-semibold flex items-center gap-2">
      <span>→</span> <span>Kubernetes Ingress Controller Explained: Architecture, Routing, and Implementation</span>
    </a>
  </li>