Quick Answer
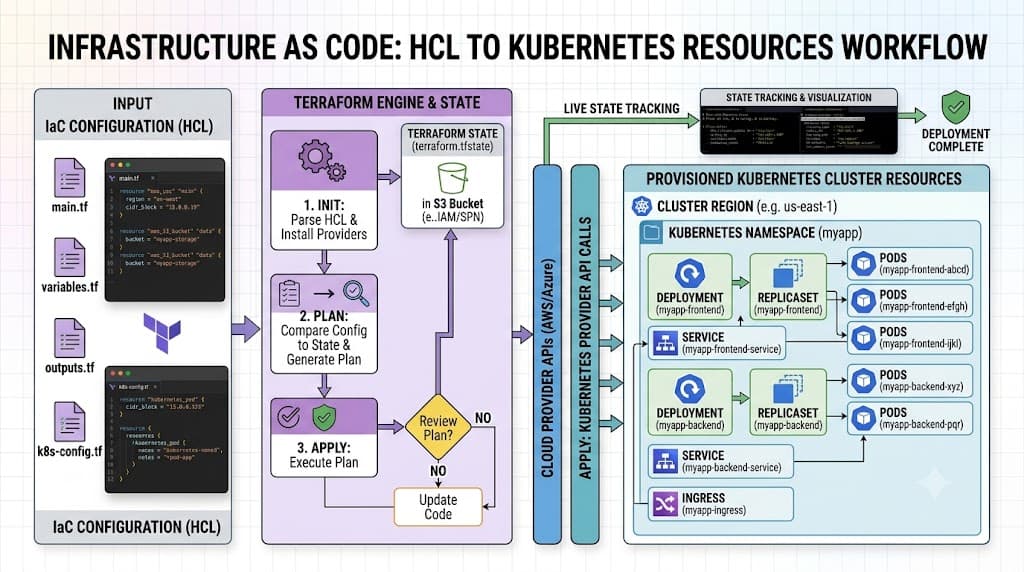
A kubernetes pod is the smallest, most fundamental deployable computing unit that can be created and managed in Kubernetes. It encapsulates one or more containers, shared storage volumes, a unique network IP address, and a set of rules dictating how the containers should run. Understanding how a kubernetes pod operates is the foundational step for any developer or administrator working with containerized workloads at scale in a modern orchestration platform.
Quick Answer
A kubernetes pod represents a single instance of a running process within your cluster, containing one or multiple tight-knit containers that share storage, network resources, and administrative specifications. To inspect and verify pods immediately in your environment, use the command kubectl get pods to list all running workloads across your namespace, followed by kubectl describe pod
What a Pod Is
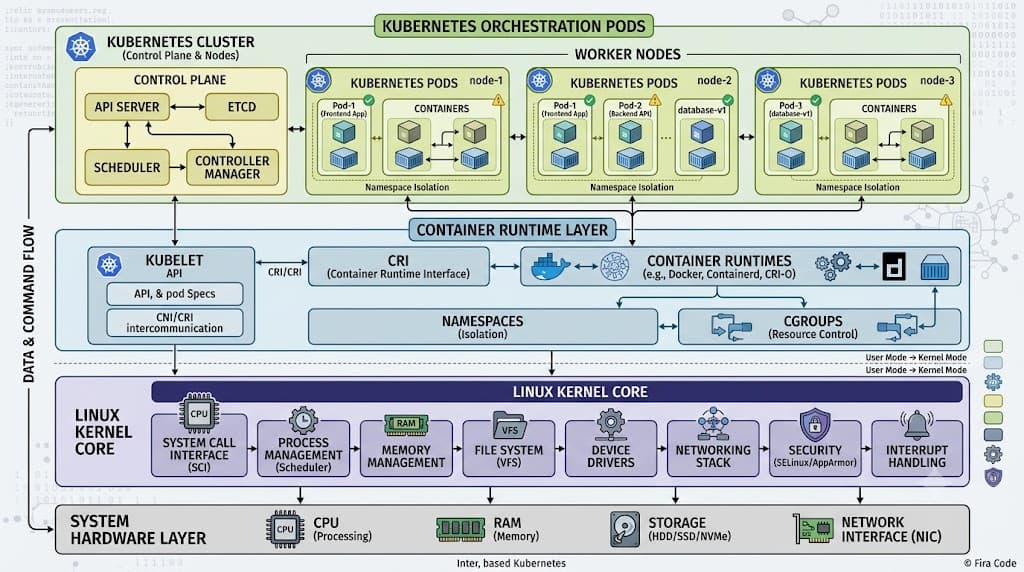
Many newcomers to container orchestration mistakenly view a kubernetes pod as a direct synonym for a Docker container. In reality, a pod is a higher-level wrapper—a logical host environment that groups multiple containers together. If you have legacy applications or tightly coupled services that were originally designed to run on the same physical or virtual machine, a pod allows you to migrate those components into Kubernetes without rewriting them into monolithic binaries.
Within this wrapper, containers share resources like local storage and network namespaces, while remaining isolated from other pods running on different nodes in the cluster. This architectural pattern decouples your application logic from the physical infrastructure. Kubernetes does not run containers directly; it wraps them in a kubernetes pod, managing their lifecycle, scaling policies, and scheduling constraints collectively.
Pod Anatomy
A kubernetes pod is defined using a declarative YAML manifest containing specific structural sections: apiVersion, kind, metadata, spec, and status. The metadata block includes essential identifiers such as the pod name, namespace, annotations, and labels. Labels are particularly crucial because Kubernetes controllers use label selectors to manage and target groups of pods dynamically.
The spec section defines the actual desired state of the workloads. This includes the container images, environment variables, resource requests and limits, security contexts, restart policies, and volume attachments. The status section, managed automatically by the control plane, reflects the current operational state of the running kubernetes pod, including its phase, IP address, start time, and container-specific readiness conditions.
apiVersion: v1
kind: Pod
metadata:
  name: webapp-pod
  labels:
    app: frontend
spec:
  containers:
  - name: nginx
    image: nginx:1.25
    ports:
    - containerPort: 80
Multi-Container Pods
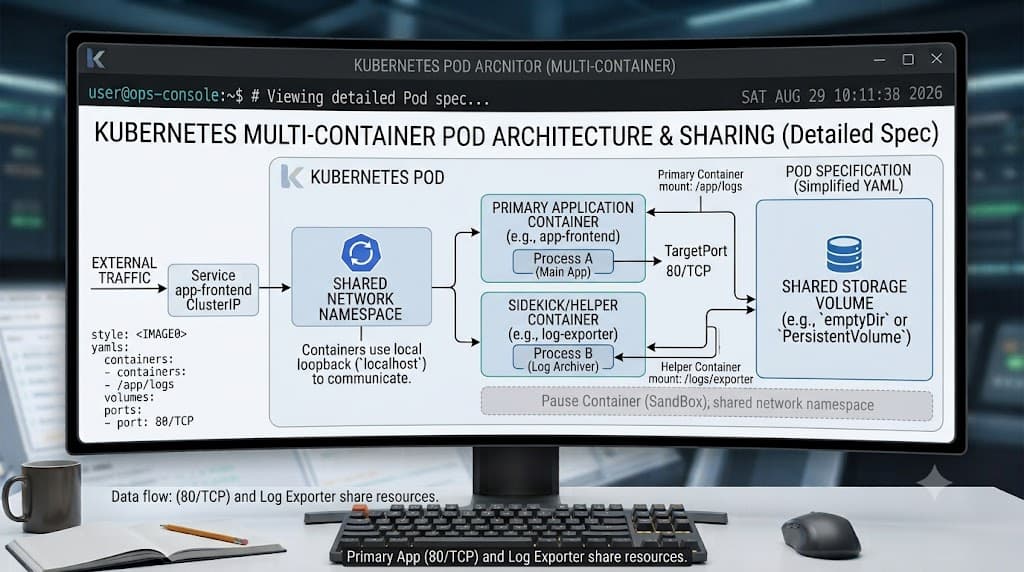
While the vast majority of deployments utilize single-container workloads, Kubernetes fully supports multi-container pods. These specialized configurations are designed for helper containers that work in direct coordination with the primary application container. Common design patterns include the sidecar pattern, ambassador pattern, and adapter pattern.
Containers within the same kubernetes pod share identical localhost networking and storage volumes. This enables high-performance, low-latency inter-process communication via local TCP ports or shared Unix domain sockets. For example, a primary web application container can write log files to a shared emptyDir volume, while a sidecar logging agent container reads those logs and streams them to an external monitoring platform.
Networking and Storage
See also: Kubernetes networking fundamentals
Every kubernetes pod is assigned a unique, routable IP address within the cluster network. All containers inside the same pod share this network namespace, including the IP address and network ports. Consequently, two containers running inside the exact same kubernetes pod must not bind to the same port number, or a port conflict will occur. Communication between containers on localhost is instantaneous and reliable.
For persistent data and inter-container sharing, pods utilize volumes. A volume defined at the pod spec level can be mounted into one or more containers. While ephemeral storage like emptyDir disappears when the pod terminates, persistent volumes backed by cloud disks, network file systems, or block storage allow stateful workloads to retain data across pod restarts, rescheduling events, and node failures.
Lifecycle
A kubernetes pod moves through a well-defined sequence of phases during its existence: Pending, Running, Succeeded, Failed, and Unknown. When a user or controller submits a pod manifest, the control plane records it and schedules it to a healthy node. Once scheduled, the kubelet on that node pulls the required container images and starts the workloads.
Restart policies—Always, OnFailure, and Never—dictate how the cluster responds when container processes terminate. Controllers such as Deployments or ReplicaSets monitor pod health and automatically recreate pods if a node fails or an application crashes. It is critical to understand that raw pods do not self-heal; they rely on parent controllers to manage their long-term availability.
Inspecting and Debugging Pods
Troubleshooting applications in a distributed cluster requires fluency with command-line diagnostic tools. When a kubernetes pod fails to start or exhibits unexpected behavior, administrators rely on a standard set of kubectl commands to inspect runtime states, review container output, and execute interactive debugging sessions.
kubectl get pods
The kubectl get pods command is your primary entry point for monitoring workloads across the cluster. By appending flags such as -o wide, you can view the assigned node IP and node name for each pod. Adding --watch allows you to observe state transitions in real time as pods move from ContainerCreating to Running. Filtering by namespace using -n
kubectl describe pod
When a kubernetes pod gets stuck in CrashLoopBackOff or Pending states, kubectl describe pod provides comprehensive diagnostic output. This command queries the API server for both the pod configuration and recent cluster events. The Events section at the bottom of the output is especially valuable, revealing scheduling failures, image pull errors, and failed liveness probes.
kubectl logs
To diagnose application runtime errors inside a container, kubectl logs retrieves standard output and standard error streams. If a kubernetes pod contains multiple containers, you must specify the target container name using the -c flag. You can also tail active logs using -f or view logs from a previously crashed container instance using the --previous flag.
kubectl exec
When log inspection is insufficient, kubectl exec allows developers to open an interactive shell inside a running container. Executing kubectl exec -it
📌 Recommended Next Guides & References
  <li>
    <a href="/article/docker-and-kubernetes-how-they-work-together-2" class="text-primary hover:underline font-semibold flex items-center gap-2">
      <span>→</span> <span>Docker and Kubernetes: How They Work Together</span>
    </a>
  </li>

  <li>
    <a href="/article/kubernetes-ingress-explained" class="text-primary hover:underline font-semibold flex items-center gap-2">
      <span>→</span> <span>Kubernetes Ingress Explained: Routing, Controllers, and TLS</span>
    </a>
  </li>

  <li>
    <a href="/article/kubernetes-ingress-controller-explained" class="text-primary hover:underline font-semibold flex items-center gap-2">
      <span>→</span> <span>Kubernetes Ingress Controller Explained: Architecture, Routing, and Implementation</span>
    </a>
  </li>