Quick Answer
Kubernetes v1.37 marks a monumental shift in cluster observability with the official graduation of native histogram support to Beta, enabled by default. For years, platform engineers and DevOps teams relied on traditional bucket-based Prometheus metrics, which often forced painful compromises between storage costs, network bandwidth, and histogram precision. With the arrival of native histograms under KEP-5808, those limitations dissolve, offering an infinitely more scalable way to track latency distributions, resource consumption, and request durations across complex microservices architectures.
Introduction to Native Histograms in Kubernetes v1.37
The formal transition of native histograms to Beta in Kubernetes v1.37 changes how cloud-native telemetry is gathered at scale. Traditional metrics exposed by the kube-apiserver, kubelet, and core controllers relied on static boundaries predefined by developers. These pre-bucketed histograms frequently failed to capture tail latencies accurately without incurring massive cardinality explosions. By enabling native histograms by default, Kubernetes v1.37 empowers monitoring systems to ingest high-resolution data streams dynamically, giving operators immediate visibility into critical performance bottlenecks.
[!NOTE] Architecture Note: Native histograms fundamentally alter how client libraries and exporters encode observations, shifting from static counters per bucket to sparse, exponentially-backed representations.
How Native Histograms Work and Their Technical Benefits
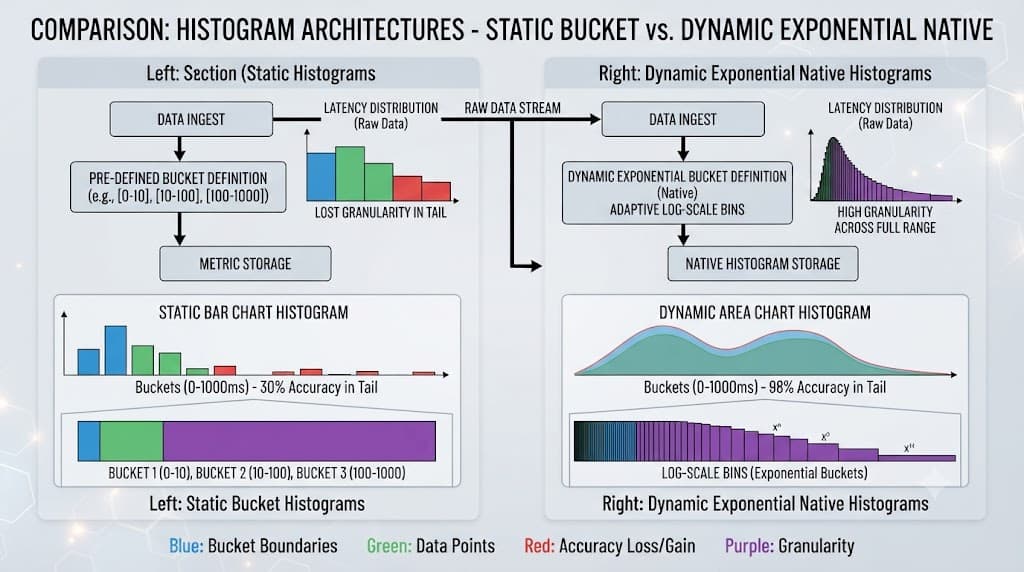
To appreciate the impact of Kubernetes v1.37, it helps to examine the underlying mechanics introduced via KEP-5808. Traditional histograms utilize a fixed array of boundaries where every bucket must be explicitly scraped and stored, regardless of whether it contains data. Native histograms use exponential bucket schemas that adapt to the range of observed values, dynamically capturing high-resolution data points where activity is dense while discarding empty ranges.
This architectural leap delivers dramatic reductions in CPU overhead during metric collection and drastically shrinks time-series database storage footprints. Teams managing large-scale infrastructure can finally analyze tail latencies (such as p99.9) with pinpoint accuracy without ballooning their monitoring budgets.
Practical Implications and Upgrading to Kubernetes v1.37
Adopting Kubernetes v1.37 in production environments requires aligning your monitoring stack—specifically Prometheus and compatible visualization tools—to fully ingest and interpret exponential histogram layouts. Because native histograms are enabled by default, clusters upgraded to v1.37 will immediately begin emitting these advanced metrics from core components.
✓ Advantages
- Inherent support for high-resolution tail latency analysis
- Significantly reduced memory and storage overhead in time-series databases
- Enabled by default in Kubernetes v1.37, eliminating manual feature-gate toggling
✕ Limitations
- Requires compatible Prometheus scraper versions for full feature utilization
- Dashboards and alerting rules may need updates to leverage new query functions
[!TIP] Pro Tip: Before upgrading production workloads to Kubernetes v1.37, audit your existing Prometheus recording rules and alerting expressions to ensure they take advantage of native histogram quantile functions rather than legacy estimation methods.