Quick Answer
To check container output immediately, run the simplest correct command: docker logs <container_name_or_id>. This command immediately prints all captured standard output (stdout) and standard error (stderr) generated by the application running inside the container since it started, sending the output directly to your terminal before returning control to the command line. If you only need to verify that an application booted up correctly or check for immediate startup errors, this single command gives you an instant view of the container state without requiring you to attach to the running session or open an interactive shell.
Quick Answer
When you need to check container logs rapidly, run docker logs <container_id>. To follow live output updates, append the -f flag, and use --tail 50 to restrict output to the last fifty lines. This combination covers the vast majority of daily debugging scenarios for developers and system administrators working with containerized workloads.
How to View Docker Container Logs
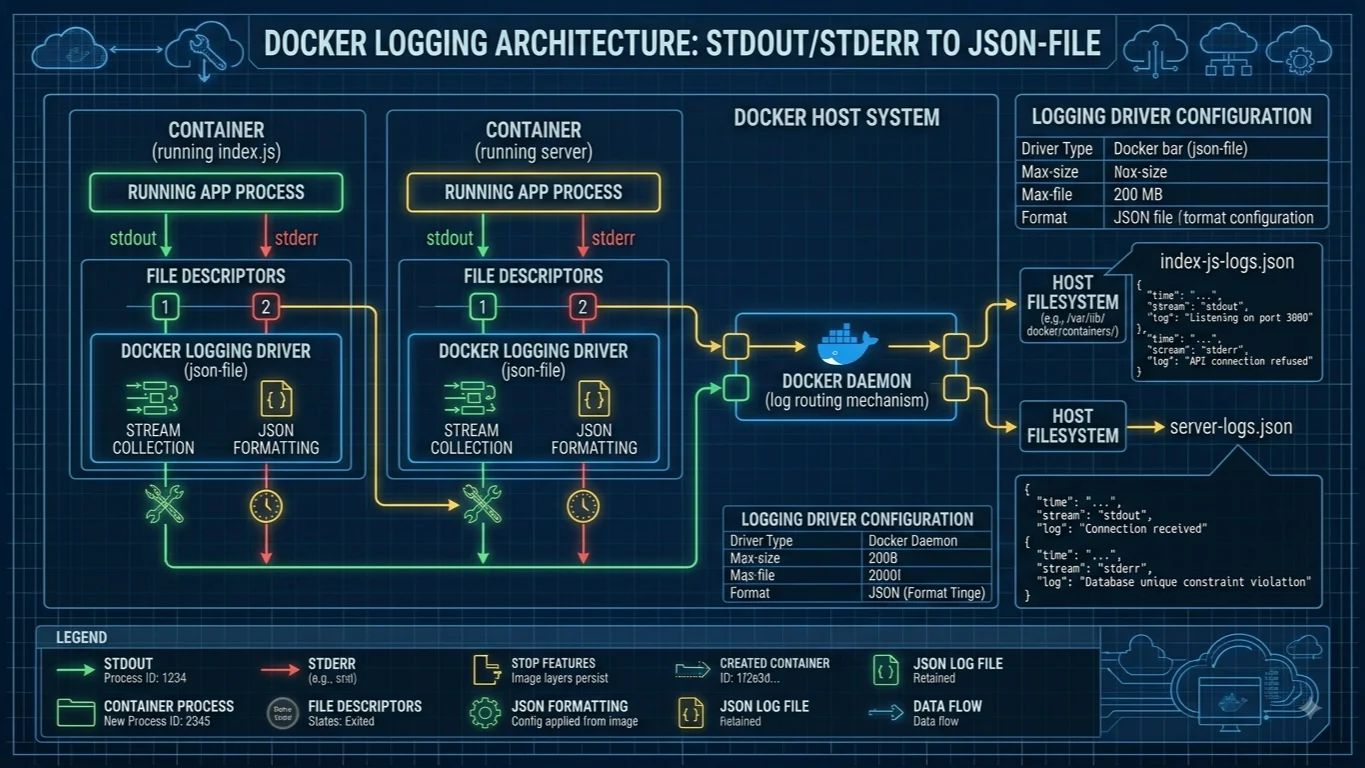
The standard syntax for checking application output relies on the core CLI tool. When you execute docker logs container, the Docker daemon fetches the recorded stream from the container logging driver and outputs it to your screen. By default, containers capture both standard output and standard error from the main application process. Understanding how these streams behave helps you differentiate normal application logging from fatal runtime exceptions.
Applications running in containers typically write operational messages to stdout, while stack traces, uncaught exceptions, and warning messages route through stderr. Docker captures both channels simultaneously and interleaves them in chronological order. However, depending on how your application framework configures its logging library, text might be buffered in memory rather than flushing instantly to the console. If you notice delayed output when inspecting container streams, check whether your application framework requires disabling output buffering for container environments.
Follow Logs in Real Time
Debugging live issues often requires tracking ongoing activity rather than reviewing historical output. You can use docker logs -f to follow log streams in real time as your application processes incoming requests. The -f flag keeps the terminal connection open, streaming new lines as they are generated by the container until you explicitly press Ctrl+C to terminate the stream.
To make real-time streaming manageable, you can combine the follow flag with tailing and timestamp flags. For example, executing docker logs -f --tail 100 displays the last one hundred historical lines and then continues streaming new output live. This ensures you have immediate context of recent application state before watching subsequent events unfold, making it exceptionally useful when reproducing intermittent bugs or monitoring deployment rollouts.
Useful docker logs Options
Filtering and formatting flags allow you to narrow down massive streams of text. When working with busy production containers, reading raw output is impractical without specific flags. The --tail option restricts output to a specific number of recent lines, such as docker logs --tail 100, preventing your terminal from getting overwhelmed by historical data.
Adding timestamps with docker logs -t prefixes every single log line with an RFC3339-compliant UTC timestamp. This is invaluable when correlating application events across multiple containers or matching container errors with infrastructure metrics. Furthermore, you can filter output by time using --since and --until. For instance, running docker logs --since 10m retrieves logs generated exclusively within the last ten minutes, while specific ISO timestamps allow you to isolate exact incident windows during post-mortem investigations.
Docker Compose Logs
When managing multi-container applications locally, inspecting individual containers one by one becomes tedious. Docker Compose simplifies log aggregation by combining output from every service defined in your compose file into a single, color-coded terminal view. Running docker compose logs -f tails the logs for your entire application stack simultaneously.
Compose assigns a distinct color to each service name prefix in the output stream, making it easy to distinguish database queries from web server requests or worker queue logs. If you need to troubleshoot a specific component within the stack rather than the entire system, you can scope the command by appending the service name, such as docker compose logs -f web. This targeted approach keeps your debugging session clean and focused.
Where Docker Logs Are Stored
Under the hood, Docker stores container output on the host filesystem according to the configured logging driver. By default, the json-file logging driver writes stdout and stderr streams as JSON-formatted log files located in the Docker data directory, typically under /var/lib/docker/containers/<container_id>/<container_id>-json.log on Linux hosts.
Each log entry contains the log payload, the stream type, and the exact timestamp. While you can technically inspect these files directly using standard Linux utilities like cat or grep, doing so is generally discouraged while containers are actively writing, as manual file modifications can corrupt the logging daemon's internal state. Always prefer using the official CLI commands to interact with container output safely.
Docker Daemon and Service Logs
Container logs represent individual application outputs, but sometimes you need to troubleshoot the Docker engine itself or orchestrated cluster workloads. Docker daemon logs capture events related to container lifecycle management, networking changes, and image pulls. On systemd-based Linux distributions, you can view daemon logs using journalctl -u docker.service.
For container environments managed via Docker Swarm, individual container logs remain accessible on the specific worker node where the task runs. However, cluster administrators can use docker service logs <service_name> to aggregate log streams across all replicas of a Swarm service into a unified view, complete with replica identifiers and task IDs.
Missing or Empty Logs
Encountering empty or missing output when running inspection commands can be frustrating. The most common reason for missing logs is the use of a custom logging driver that discards output or routes it to an external system, such as syslog, fluentd, or AWS CloudWatch, rather than storing it locally.
Another frequent cause is container re-creation or removal. Standard container logs are tied directly to the container lifecycle; when a container is removed using docker rm, its default log file is deleted from disk. If your application process crashes immediately upon startup due to a missing environment variable or invalid configuration, the container exits before generating readable output, resulting in an empty terminal. In such cases, inspect the container exit code or run it interactively to diagnose startup failures.
Managing Large Logs Safely
Unchecked application logging can quickly consume all available disk space on your host machine, leading to system instability. To prevent this, you should configure log rotation policies globally in the Docker daemon configuration file (/etc/docker/daemon.json) or locally within individual Docker Compose files using logging options like max-size and max-file.
If you need to clear accumulated logs for a stopped container without removing the container itself, avoid deleting files directly inside /var/lib/docker/containers/. Instead, truncate the underlying log file safely using standard shell redirection from the host, such as truncate -s 0 /var/lib/docker/containers/<id>/<id>-json.log, or rely on proper daemon-level log rotation policies to automatically prune old files.
Common Mistakes
Users frequently make avoidable errors when working with container output. One common mistake is attempting to run log filtering flags in the wrong order; flags like --tail and --since must precede the container name in the command syntax. Another frequent error is forgetting that standard container logs do not persist across container removal unless external log aggregation drivers are configured.
Developers also occasionally attempt to use docker clear logs or similar non-existent commands, leading to syntax errors. Remember that Docker does not provide a direct single-word command to clear logs; instead, log management is handled through logging driver configurations, rotation settings, or careful file truncation on the host system when necessary.
📌 Recommended Next Guides & References
  <li>
    <a href="/article/docker-and-kubernetes-how-they-work-together-2" class="text-primary hover:underline font-semibold flex items-center gap-2">
      <span>→</span> <span>Docker and Kubernetes: How They Work Together</span>
    </a>
  </li>

  <li>
    <a href="/article/kubernetes-ingress-explained" class="text-primary hover:underline font-semibold flex items-center gap-2">
      <span>→</span> <span>Kubernetes Ingress Explained: Routing, Controllers, and TLS</span>
    </a>
  </li>

  <li>
    <a href="/article/kubernetes-ingress-controller-explained" class="text-primary hover:underline font-semibold flex items-center gap-2">
      <span>→</span> <span>Kubernetes Ingress Controller Explained: Architecture, Routing, and Implementation</span>
    </a>
  </li>