Quick Answer
Containerization has fundamentally transformed the way modern applications are developed, shipped, and executed across various environments. When you run your software inside lightweight isolated environments, maintaining complete visibility into its runtime behavior becomes an absolute necessity. Monitoring your application output is critical for application health, performance tuning, and rapid debugging when things go wrong unexpectedly. Without a clear mechanism to inspect what your application is writing to the console, diagnosing a silent crash or an unhandled exception feels like searching for a needle in a dark haystack. Fortunately, the Docker ecosystem provides robust built-in tooling designed to capture, store, and stream your application runtime output effortlessly. By understanding how to harness these diagnostic tools effectively, developers, system administrators, and DevOps engineers can dramatically reduce their mean time to resolution and ensure high availability across production clusters.
Definition and Core Concepts
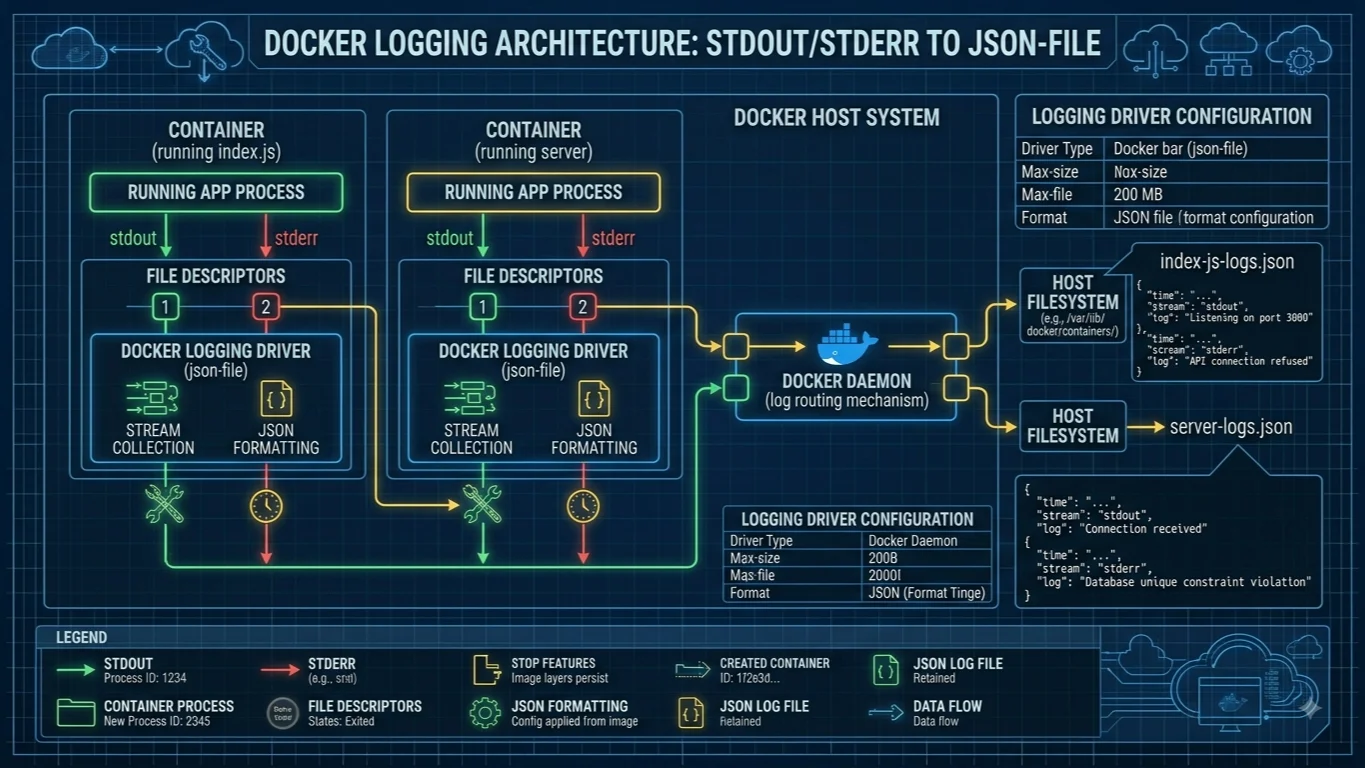
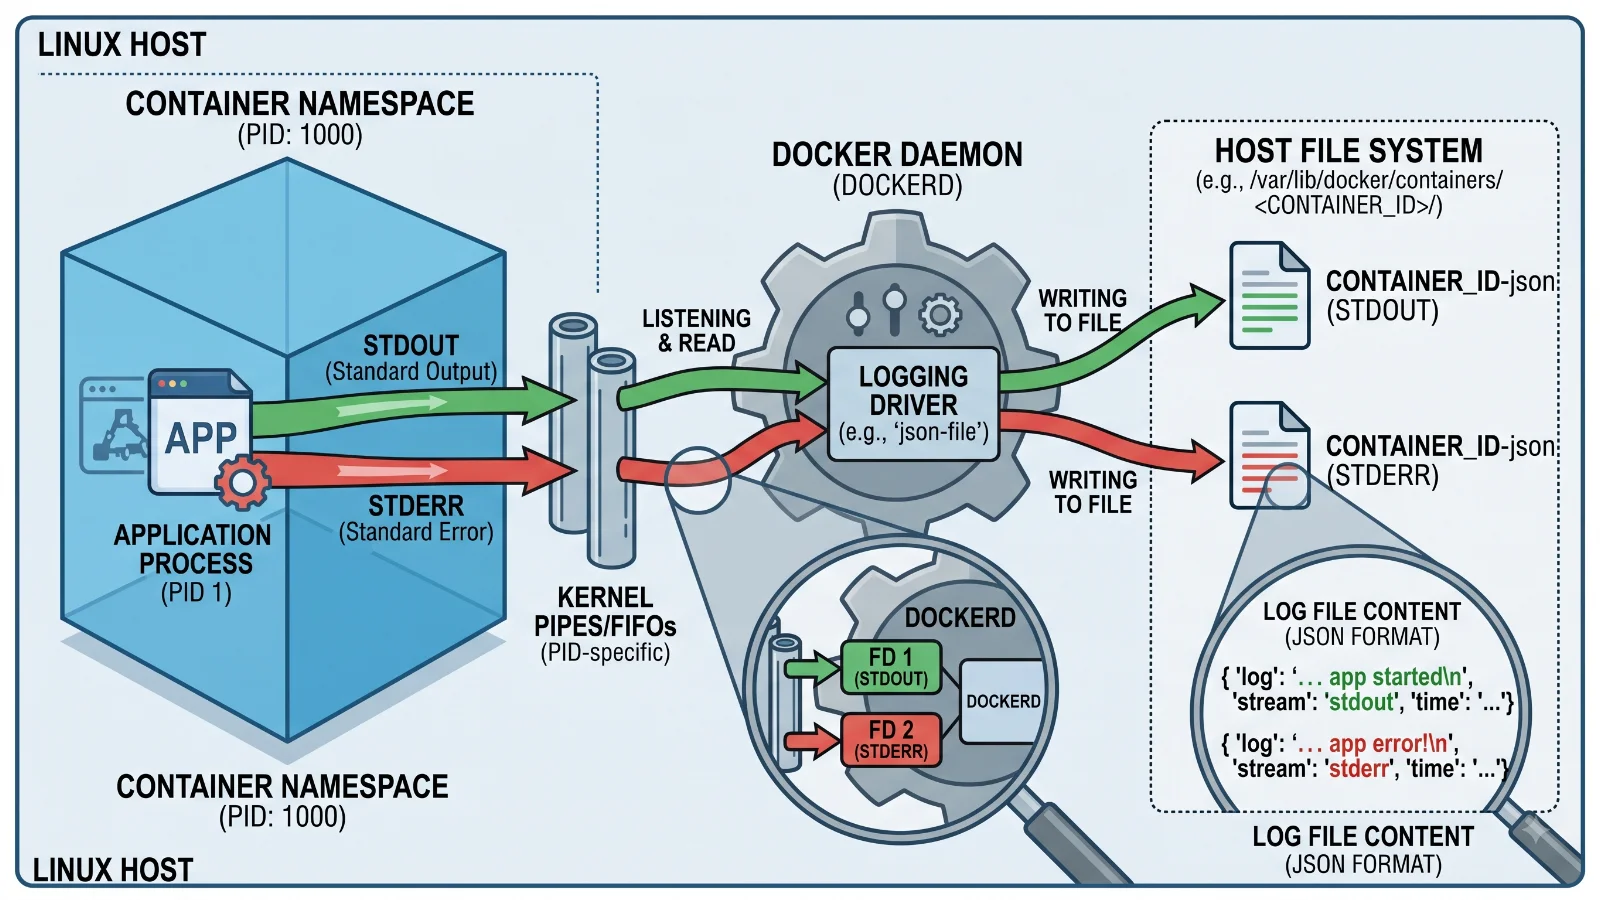
At its core, Docker container logs refer to the standard output and standard error streams generated by the primary process running inside a container instance. When you execute an application natively on an operating system, it typically writes diagnostic messages, access logs, and error traces directly to the console terminal. Inside a containerized architecture, these streams are captured directly by the Docker daemon running on the host system. Standard output captures normal operational messages, status updates, and successful transaction details, while standard error is specifically reserved for exceptions, warnings, and fatal crash logs. Docker acts as an intermediary, intercepting these file descriptors from the container runtime namespace and channeling them into managed storage locations. Understanding this fundamental distinction between standard output and standard error helps you configure proper log levels in your application code, ensuring that critical failures stand out immediately during an active debugging session while routine informational messages remain safely cataloged for historical auditing.
How Docker Logs Work
To truly master container troubleshooting, it helps to look under the hood at how the Docker daemon handles log persistence on the host operating system. When a container starts, the Docker runtime assigns a specific logging driver to capture the output streams. By default, most installations utilize the local json-file logging driver, which serializes every line of standard output and standard error into a structured JSON file stored within the host directory structure. These files are typically located under the /var/lib/docker/containers/ path, nested inside a directory named after the unique container identification hash. Each log entry contains the exact log message string, the stream type, and an ISO-8601 high-precision timestamp. While this default approach works seamlessly for out-of-the-box development workflows, enterprise environments often configure alternative logging drivers such as syslog, fluentd, journald, or AWS CloudWatch to forward these text streams directly to centralized log management platforms. The underlying storage mechanism dictates how long your logs persist, how much disk space they consume, and whether they survive container termination or removal operations.
Key Components and Flags
For more detail, see Docker Compose logs.
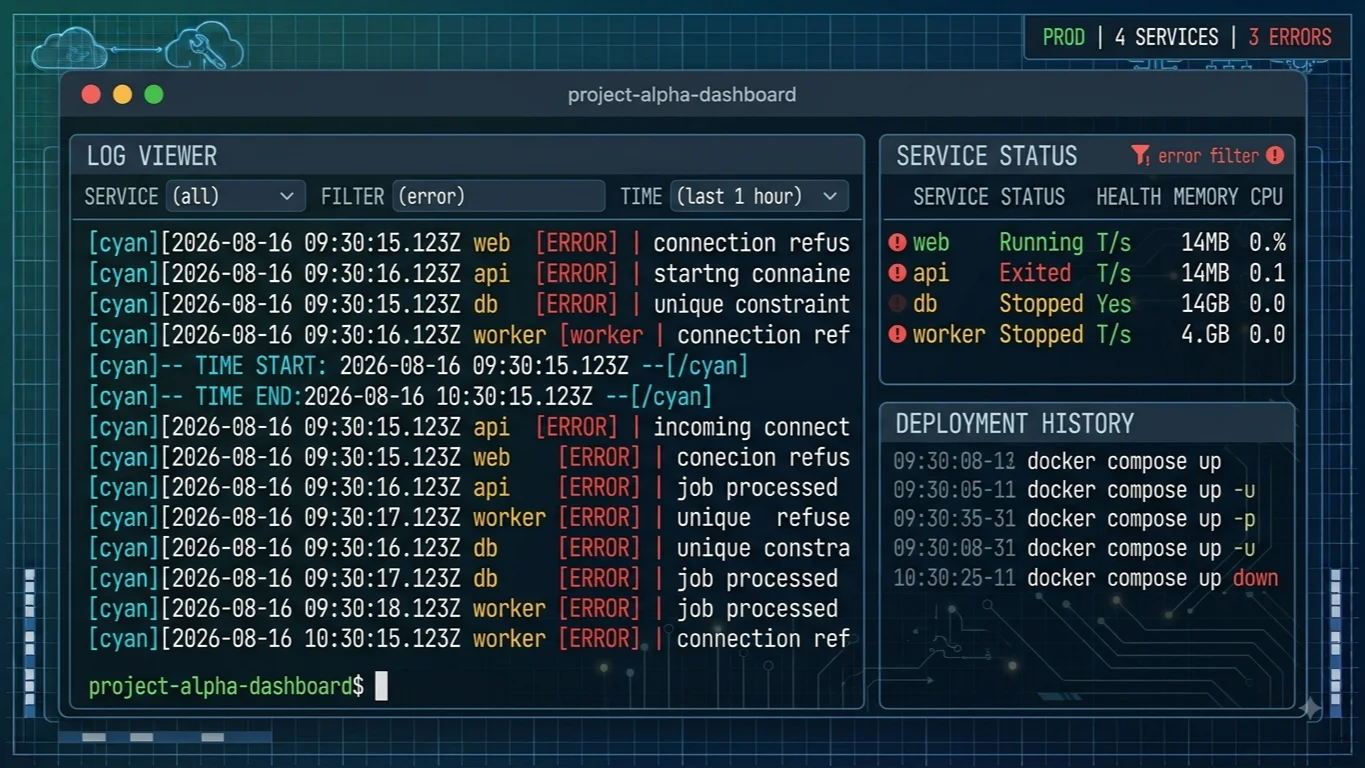
Interacting with container output requires familiarity with the primary command-line interface utility, specifically the docker logs command. This command accepts several powerful flags designed to filter, format, and stream logs according to your immediate diagnostic needs. One of the most frequently utilized flags is --follow or -f, which transforms the static log retrieval command into a live streaming view similar to the Unix tail utility. Another indispensable parameter is --tail, which allows you to restrict the output volume by specifying the exact number of lines to display from the end of the log history, preventing your terminal from being flooded with thousands of historical boot messages. When investigating time-sensitive incidents, the --since and --until flags enable you to slice log data by precise relative durations or absolute timestamps, narrowing down your investigation window. Additionally, appending the --timestamps flag prefixes every single line of output with its exact generation time, offering immediate chronological context when correlating logs across distributed microservices or multi-container application stacks.
Practical Examples of Viewing Logs
Putting these flags into practice allows you to handle real-world operational scenarios with confidence and speed. Consider a common scenario where a web application container crashes unexpectedly in a staging environment. To inspect the most recent activity, you can execute a basic command specifying the container name or identifier, such as running docker logs web_app_service. If the log file is extremely large due to verbose debugging configurations, you can combine flags to isolate the most recent events by running docker logs --tail 50 web_app_service. When you need to monitor an active background process in real time while triggering a test request against your application endpoint, you combine the streaming and timestamp features using docker logs --follow --timestamps web_app_service. For scenarios involving post-mortem analysis of a production incident that occurred between specific hours, operators frequently leverage absolute time filters, executing a command formatted like docker logs --since 2023-10-01T08:00:00 --until 2023-10-01T09:30:00 web_app_service. These hands-on commands form the foundational toolkit for day-to-day container inspection and troubleshooting workflows.
Benefits of Effective Log Management
Implementing a disciplined approach to container log management yields substantial operational benefits across the entire software development lifecycle. Quick incident response stands out as the primary advantage, as developers can instantly verify whether an application deployment successfully initialized or encountered a database connection failure within seconds of startup. Furthermore, robust log monitoring enhances system observability, making it significantly easier to track performance bottlenecks, anomalous request patterns, and unauthorized access attempts. When logs are consistently formatted and systematically reviewed, teams can establish proactive alerting rules rather than waiting for end users to report system outages. This proactive posture not only protects brand reputation but also fosters greater collaboration between development and operations teams, as both groups share a single source of truth regarding application behavior derived directly from container output streams.
Limitations and Pitfalls
See also: container removal command
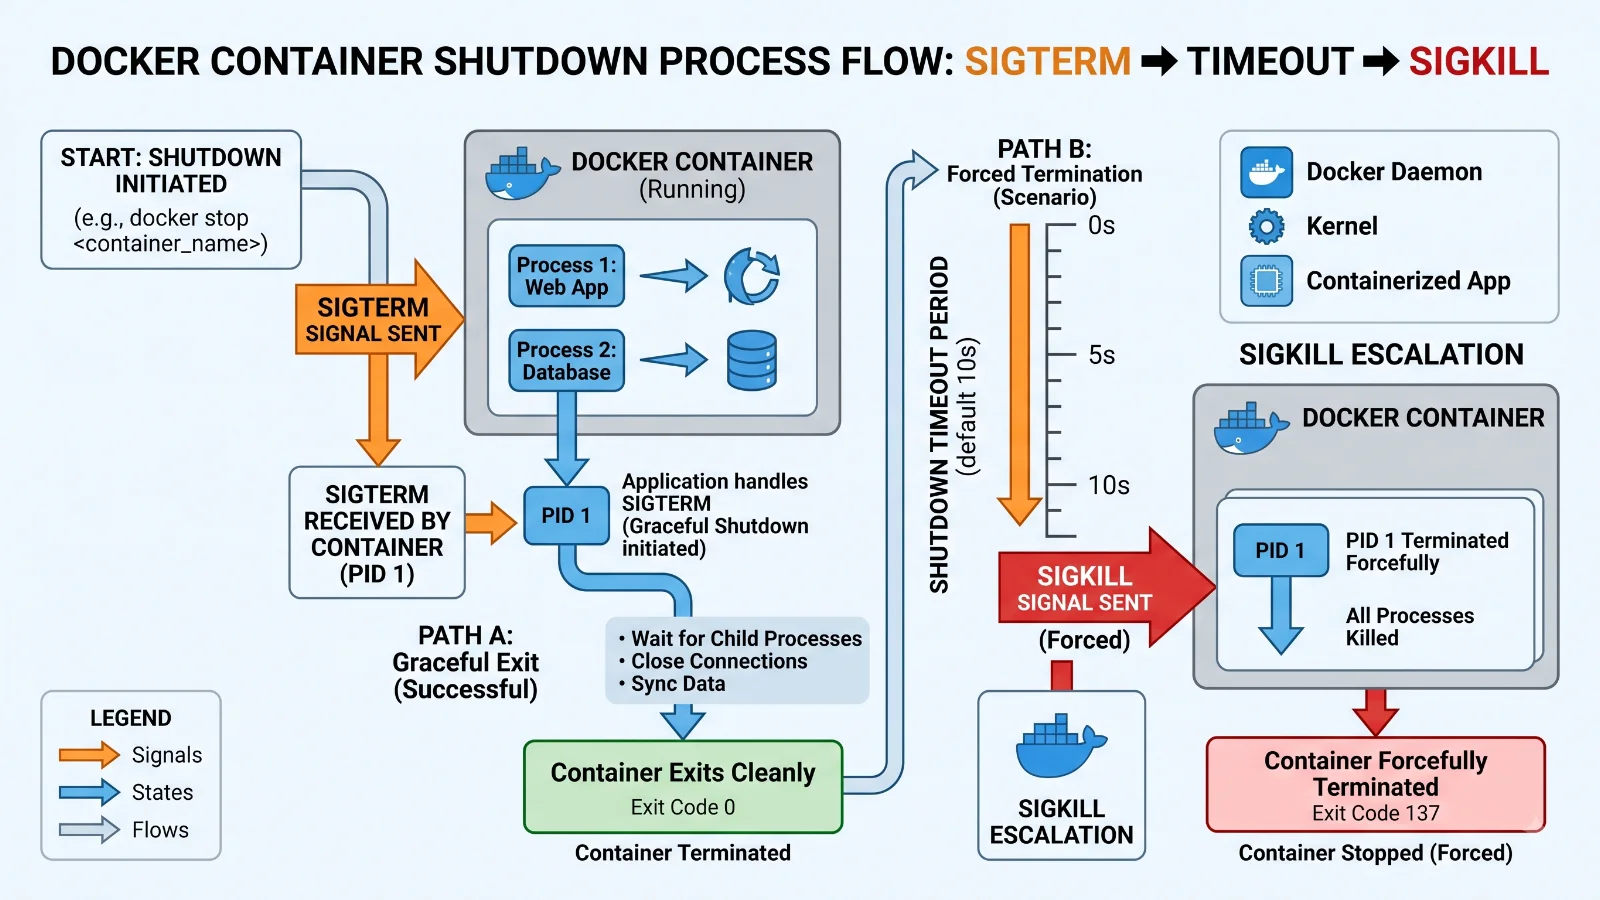
Despite their undeniable utility, native Docker container logs come with specific limitations and common operational pitfalls that every administrator must navigate carefully. The most pervasive danger involves disk space exhaustion caused by unrotated log files. By default, the standard JSON file logging driver grows indefinitely without automatic truncation or rotation, eventually consuming every available byte on the host root partition and causing catastrophic system failures. Another notable limitation is that container logs are inherently tied to the container lifecycle; when you execute a standard container removal command, the associated log files are permanently deleted unless you have explicitly configured external log shipping or volume mounts. Furthermore, relying solely on text-based console output for complex enterprise applications can hinder advanced querying, as unstructured plain text lacks the rich indexing capabilities found in dedicated application performance monitoring and log aggregation platforms.
Frequently Asked Questions
Where are Docker container logs stored on the host machine?
Docker container logs are typically stored on the host filesystem under the /var/lib/docker/containers/<container-id>/ directory, saved as JSON-formatted files by default when using the standard json-file logging driver.
How can I clear or delete Docker container logs to save disk space?
You can truncate a running container's log file directly from the host terminal by emptying the corresponding log file path, or you can configure global log rotation policies inside your Docker daemon configuration file (daemon.json) to limit file size and count automatically.
Can I view logs from multiple containers at the same time?
While the native docker logs command accepts only a single container identifier per execution, you can easily stream logs from multiple containers concurrently by utilizing popular third-party orchestration tools like Docker Compose with the <a href="/article/mastering-docker-compose-networking-practical-guide" class="text-primary font-semibold hover:underline">docker compose</a> logs command, or by employing external monitoring solutions.
How do I filter Docker logs by date or time?
You can filter logs by specific timeframes using the --since and --until flags, supplying either relative time strings like 10m or 2h, or absolute ISO-8601 timestamps.
Conclusion
Mastering container output inspection is an essential skill for anyone building, deploying, or maintaining modern software inside isolated runtime environments. Throughout this guide, we explored the fundamental architecture behind standard output capture, the role of logging drivers, and the practical application of essential command-line flags like --follow, --tail, and --timestamps. While native logging commands provide immediate visibility for day-to-day debugging, practitioners must remain mindful of disk space management and log rotation policies to prevent unexpected host system outages. By combining solid command-line proficiency with proactive monitoring strategies, you can ensure your containerized applications remain healthy, transparent, and resilient in any production environment.
📌 Recommended Next Guides & References
  <li>
    <a href="/article/docker-and-kubernetes-how-they-work-together-2" class="text-primary hover:underline font-semibold flex items-center gap-2">
      <span>→</span> <span>Docker and Kubernetes: How They Work Together</span>
    </a>
  </li>

  <li>
    <a href="/article/kubernetes-ingress-explained" class="text-primary hover:underline font-semibold flex items-center gap-2">
      <span>→</span> <span>Kubernetes Ingress Explained: Routing, Controllers, and TLS</span>
    </a>
  </li>

  <li>
    <a href="/article/kubernetes-ingress-controller-explained" class="text-primary hover:underline font-semibold flex items-center gap-2">
      <span>→</span> <span>Kubernetes Ingress Controller Explained: Architecture, Routing, and Implementation</span>
    </a>
  </li>