Quick Answer
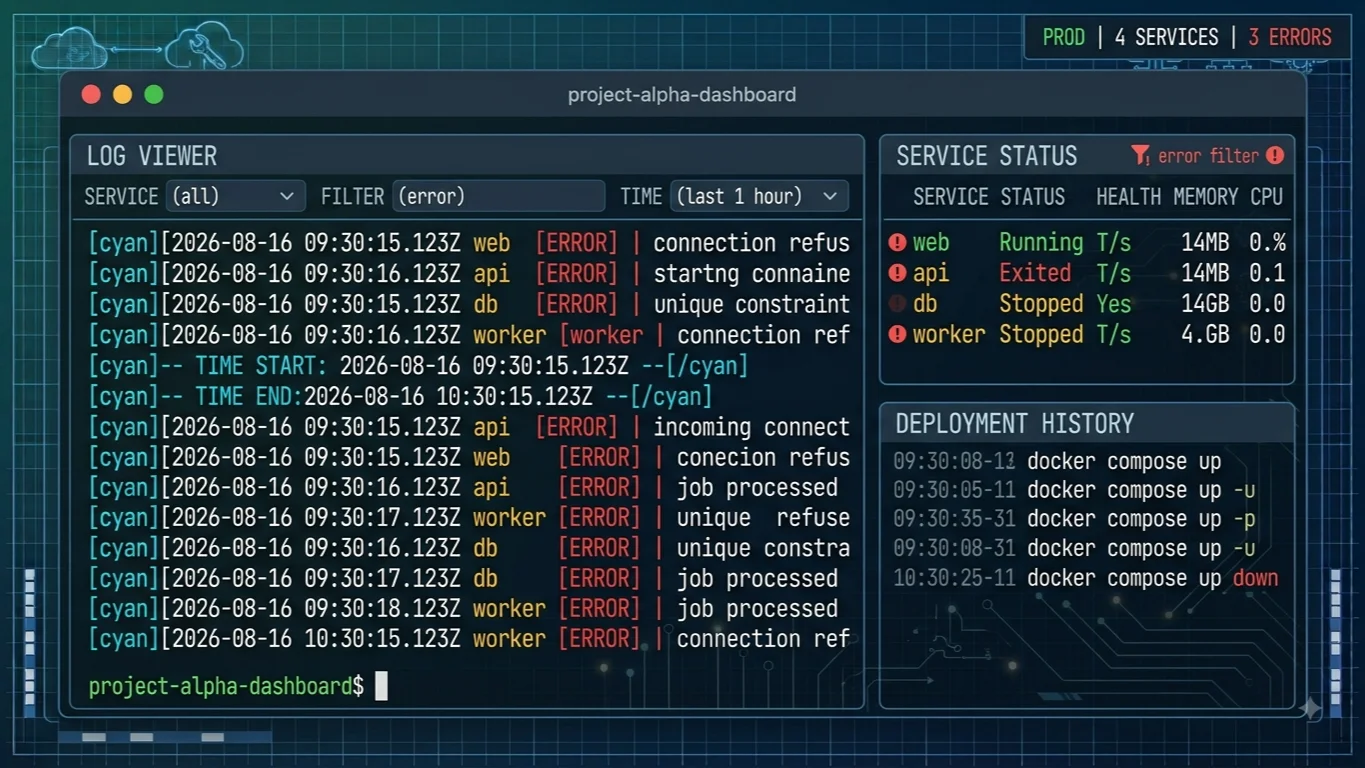
When managing multi-container applications, gaining immediate visibility into what your runtime environments are doing is crucial. Whether you are debugging a sudden container crash, tracing a slow database query, or verifying that startup scripts executed correctly, knowing how to inspect your service output is an essential DevOps skill. The primary command for this task is docker compose logs, which aggregates and streams the standard output and standard error from every container managed by your active project. By default, running this command outputs the historical logs of all containers in your compose file, color-coded by service name for easier reading. This gives you an instant birds-eye view of your entire application stack without needing to manually attach to individual containers or hunt across disparate files. From this simple baseline, you can layer on flags to filter timestamps, tail specific line counts, or isolate individual services to pinpoint exact issues.
Quick Answer
To view logs for your entire multi-container application immediately, navigate to the directory containing your docker-compose.yml file and run the most straightforward command available. Simply typing docker compose logs in your terminal will output the combined text streams from all active and stopped services defined in your configuration. If you need to focus on real-time event streaming rather than looking backward, append the follow flag by executing docker compose logs -f. This streams live container entries directly to your console as they occur, allowing you to watch application behavior dynamically during testing or deployment. For users running older legacy setups, the hyphenated syntax docker-compose logs works identically in most environments, though modern Docker installations recommend dropping the hyphen for the integrated Compose V2 plugin.
View Logs for All Compose Services
Aggregating output across an entire application stack is invaluable when services interact and errors cascade from one component to another. When you run the unadulterated command without specifying a target service name, Docker Compose queries the daemon for every container defined in your project configuration. Each line prepends the service name and container number as a distinct tag, making it clear whether an error originated from your api container, your worker queue, or a reverse proxy like Nginx. This aggregated view respects the lifecycle of your deployment, pulling historical records even from containers that have already exited, provided they have not been explicitly removed with cleanup commands. Examining this combined stream helps identify synchronization issues, such as a backend service attempting to accept incoming connections before a database container has finished initializing its storage volumes.
View Logs for One Service
While viewing every system message at once is helpful during early boot sequences, large applications quickly generate overwhelming output when all containers speak simultaneously. To isolate a specific component and eliminate background noise, you can target a single service by appending its name directly to your command. For example, running docker compose logs web focuses solely on the container or containers associated with your web service definition. This restricts the text stream to that precise context, making it much easier to trace HTTP request lifecycles, application exceptions, or framework-specific debug messages without interference from background worker tasks or database maintenance routines. If your project scales a service horizontally using replica settings, Docker Compose automatically aggregates the output from every active instance of that specific service while still keeping other application components completely out of view.
Follow and Tail Compose Logs
Static historical snapshots are useful for post-mortem analysis, but active debugging often demands real-time observation and concise output windows. The follow flag, written as docker compose logs -f, transforms your terminal into a live streaming dashboard where new container entries appear instantly as your application processes requests. Because historical output can span thousands of lines and flood your terminal history, you can combine this with line-truncation controls to keep your workspace clean. Executing docker compose logs --tail 100 restricts the initial history dump to the final one hundred lines per service before continuing to follow live updates. Alternatively, you can use docker compose logs --tail 50 web to view only the most recent fifty lines from a targeted service, striking an ideal balance between historical context and immediate readability.
Useful Log Filters
When tracking down intermittent bugs or verifying events that occurred at a specific time, viewing thousands of irrelevant lines wastes valuable troubleshooting time. Docker Compose provides precise filtering mechanisms to narrow your viewing window effectively. You can add exact timing markers by supplying the timestamps flag alongside a time boundary, such as docker compose logs --since 2023-10-01T12:00:00 or relative expressions like docker compose logs --since 30m to review only what happened in the last half-hour. Similarly, the until flag allows you to bound your search upper limit, preventing your screen from filling up with modern entries when you are investigating a historical incident. Combining these date filters with service specifiers allows you to isolate exact incident windows across complex microservice architectures with surgical precision.
Where Compose Logs Are Stored
A common point of confusion for administrators is determining where their application output lives on the host filesystem. Unlike traditional monolithic applications that write plain text files into a dedicated log directory, Docker does not store container output in a single fixed folder inside your project directory. Instead, log storage locations depend entirely on the underlying Docker logging driver configured for your containers. By default, Docker uses the json-file logging driver, which encodes standard output and standard error streams as JSON objects stored within the Docker daemon directory structure, typically under /var/lib/docker/containers/ on Linux systems. Because these files grow continuously as your application runs, relying on default configurations without proper infrastructure management can eventually consume all available disk space on your host machine, leading to system-wide instability.
Troubleshoot Service Errors
When a container fails to start or crashes repeatedly during runtime, Compose output serves as your primary diagnostic tool. Startup failures often manifest as exit codes or immediate application panics printed right before the container stops. If a service exits immediately, running docker compose logs without the follow flag lets you review the exact stack trace or missing environment variable warning that caused the crash. For intermittent runtime errors, combining targeted service names with tail flags helps you catch the exact moment an exception is thrown. Pay close attention to standard error streams, which Docker highlights or handles separately depending on your terminal configuration, ensuring you spot missing database tables, connection timeouts, or misconfigured network bindings before they impact production users.
Log Management and Rotation
Enterprise environments and high-traffic development setups require proactive management to prevent unbounded log growth from filling host storage partitions. Rather than relying on manual deletion or destructive commands, you should configure log rotation directly inside your docker-compose.yml file using the logging driver options block. By specifying options such as max-size and max-file under your service definitions, you instruct the Docker daemon to automatically rotate files once they reach a specified threshold and retain only a limited number of historical archives. This declarative approach ensures sustainable disk usage without requiring external cron jobs or risking accidental deletion of active container filesystems. Always evaluate your compliance and auditing requirements before adjusting these rotation limits, ensuring you retain enough historical data to satisfy security reviews and debugging needs.
📌 Recommended Next Guides & References
  <li>
    <a href="/article/docker-and-kubernetes-how-they-work-together-2" class="text-primary hover:underline font-semibold flex items-center gap-2">
      <span>→</span> <span>Docker and Kubernetes: How They Work Together</span>
    </a>
  </li>

  <li>
    <a href="/article/kubernetes-ingress-explained" class="text-primary hover:underline font-semibold flex items-center gap-2">
      <span>→</span> <span>Kubernetes Ingress Explained: Routing, Controllers, and TLS</span>
    </a>
  </li>

  <li>
    <a href="/article/kubernetes-ingress-controller-explained" class="text-primary hover:underline font-semibold flex items-center gap-2">
      <span>→</span> <span>Kubernetes Ingress Controller Explained: Architecture, Routing, and Implementation</span>
    </a>
  </li>