Quick Answer
Running containers in production requires reliable visibility into whether an application inside a container is actually functioning properly, not just whether the underlying process is running. A container can technically be in a running state even while its internal web server is deadlocked, throwing catastrophic memory errors, or failing to respond to database queries. This is precisely why monitoring container health is a foundational discipline for modern DevOps engineers and developers.
Quick Answer
To test if a container is functioning correctly, you can use the built-in Docker HEALTHCHECK instruction. The simplest way to add a basic health check to a container is inside your Dockerfile by defining a command that Docker executes periodically. For instance, adding HEALTHCHECK --interval=30s --timeout=3s CMD curl -f http://localhost/ || exit 1 instructs the Docker daemon to probe the container every thirty seconds, expecting a successful HTTP response. If the command returns a non-zero exit code, Docker registers the failure and eventually marks the container as unhealthy after a specified number of consecutive failed retries.
What Docker HEALTHCHECK Does
See also: restart a Docker container
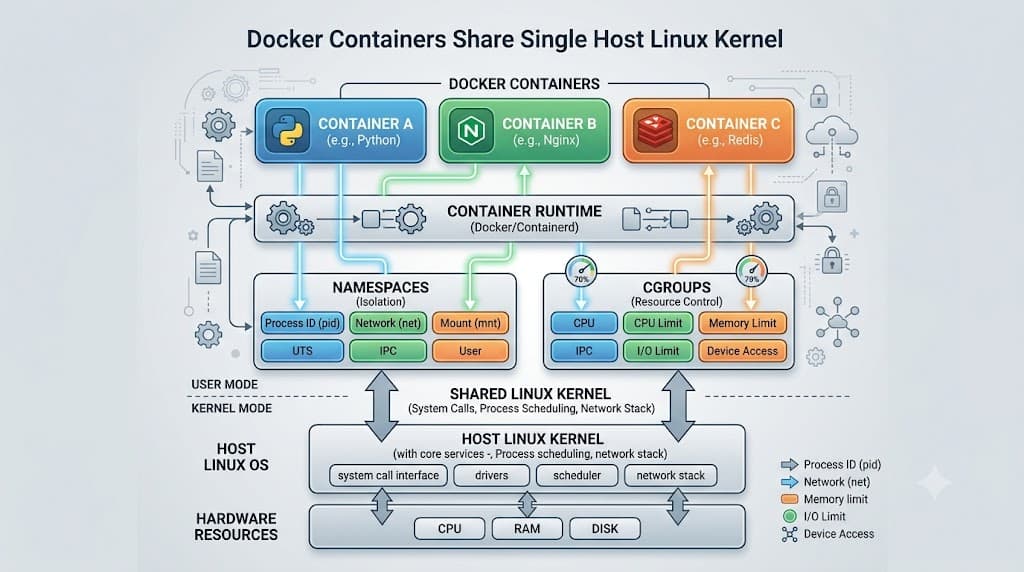
Docker container orchestration relies heavily on knowing the exact operational status of workloads. By default, the Docker daemon only knows if the main process inside the container namespace is alive. If a Node.js process or Python application enters an infinite loop or encounters a fatal deadlock, the process PID might still be active, leading Docker to report the container as healthy and running even though end users receive connection timeouts.
The health check mechanism bridges this operational visibility gap. When you configure healthchecks docker capabilities, the Docker daemon periodically executes a designated command inside the container context. This command can test database connections, probe internal web servers, or execute custom validation scripts. Based on the exit code of this command, Docker assigns one of three explicit health states to the container: starting, healthy, or unhealthy. Orchestration engines like Docker Swarm and Docker Compose use these precise status transitions to restart dead containers, drain traffic away from failing nodes, or delay startup sequences until dependent backing services are fully ready to accept connections.
Add a HEALTHCHECK to a Dockerfile
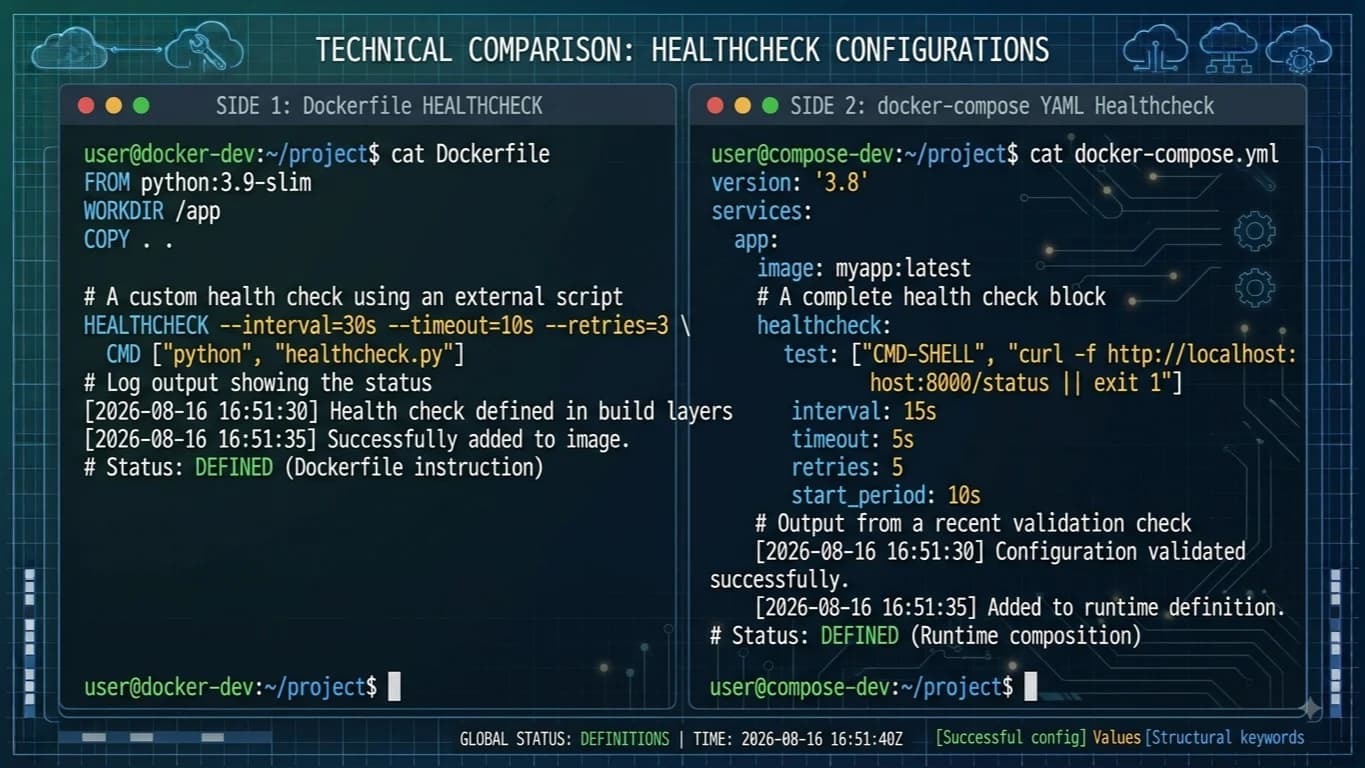
Embedding a health check directly into your image ensures that every deployment automatically inherits your monitoring logic without requiring manual configuration in external orchestration files. To add a health check to a Docker container via a Dockerfile, you use the HEALTHCHECK instruction followed by configuration flags and a command execution string.
Consider a standard web application container built on Alpine Linux. You can define a health check that verifies whether an internal Nginx web server is serving pages correctly by utilizing curl. Here is a complete Dockerfile snippet demonstrating this implementation:
FROM alpine:3.18
RUN apk add --no-cache curl nginx
EXPOSE 80
COPY index.html /var/www/localhost/htdocs/index.html

# Configure the health check instruction
HEALTHCHECK --interval=1m --timeout=5s --start-period=10s --retries=3 \
  CMD curl -f http://localhost/ || exit 1

CMD ["nginx", "-g", "daemon off;"]
When building and running this image, Docker evaluates the command according to the specified intervals. The --start-period flag gives your application time to boot up before failing the container on early connection refusals, which is critical for heavy runtimes that require warm-up time.
Configure Healthchecks in Compose
When managing multi-container local development or production stacks, configuring health checks within a docker-compose healthcheck setup becomes essential. Docker Compose allows you to declare health checks under individual service definitions using YAML syntax, mirroring the options available in standard Dockerfiles while adding powerful service dependency controls.
One of the most valuable patterns in modern container architecture is ensuring that dependent services wait for databases or cache layers to be completely responsive before initializing. Below is a practical docker-compose healthcheck example demonstrating how to configure a robust web service that waits for a PostgreSQL database to become healthy before starting up:
version: '3.8'
services:
  db:
    image: postgres:15-alpine
    environment:
      POSTGRES_USER: app_user
      POSTGRES_PASSWORD: secret_password
      POSTGRES_DB: app_db
    ports:
      - "5432:5432"
    healthcheck:
      test: ["CMD-SHELL", "pg_isready -U app_user -d app_db"]
      interval: 10s
      timeout: 5s
      retries: 5
      start_period: 20s

  web:
    image: my-web-app:latest
    ports:
      - "8080:80"
    depends_on:
      db:
        condition: service_healthy
In this configuration, the web service will not transition from the starting phase to execution until the db service explicitly reports a healthy status via pg_isready, preventing connection refused errors upon initial application boot.
Check Container Health
See also: docker container logs
Once your containers are running with active monitoring instructions, you need reliable ways to inspect health status across your environments. System administrators and developers frequently rely on the standard Docker command-line interface to audit container states.
The primary tool for checking health status is the docker inspect command. By passing a container ID or name, you can extract precise JSON-formatted health metrics, including the exact exit code, output, and timestamps of recent health check executions. To extract just the current health status string quickly, you can leverage Go templates with the format flag:
docker inspect --format='{{json .State.Health}}' my_running_container
This command returns a detailed structural breakdown showing whether the container is currently healthy, along with a history of recent checks. If you are managing containers on Windows environments using administrative tooling, a docker powershell healthcheck command accomplishes the exact same inspection goal:
(Invoke-RestMethod -Uri http://localhost/ -Method Get).StatusCode
# Or inspecting Docker object states directly via PowerShell formatting:
(docker inspect my_running_container | ConvertFrom-Json).State.Health
Understanding these inspection techniques allows automation scripts to poll container health before routing ingress traffic or executing database migrations during CI/CD pipeline deployments.
HEALTHCHECK Options Explained
Fine-tuning your monitoring parameters requires a thorough understanding of the configuration options available in Dockerfile and Compose instructions. Misconfiguring these settings can lead to false positives, cascading deployment failures, or unnecessary resource consumption.
The instruction accepts several key parameters that govern execution behavior:
--interval=DURATION: Specifies the time duration between health check runs. The default interval is typically thirty seconds. Setting this too low can overload resource-constrained applications with constant polling requests.--timeout=DURATION: Defines how long Docker will wait for the health check command to complete before treating the execution as failed. If your database probe takes longer than this threshold, it triggers a failure count.--retries=N: Sets the number of consecutive failures required before a container transitions from healthy or starting into an unhealthy state.--start-period=DURATION: Provides initialization grace time for containers that have lengthy startup sequences, such as Java Spring Boot applications or large Rails monolithic runtimes. Failed checks during this period do not increment the retry counter, shielding slow-booting applications from premature termination.
Practical HTTP and Database Examples
Different application stacks require tailored probing strategies. A static web server, a dynamic REST API, and a relational database each demand distinct command structures to accurately validate internal application health.
For standard HTTP or HTTPS endpoints, utilizing curl or wget inside a container is the industry standard. When utilizing curl, always include the -f (or --fail) flag. Without this flag, curl returns an HTTP 200 status code body even if the server responds with a 404 Not Found or a 500 Internal Server Error, which would incorrectly report an unhealthy service as healthy:
HEALTHCHECK --interval=30s --timeout=3s \
  CMD curl -f http://localhost:8080/healthz || exit 1
For database containers such as PostgreSQL, testing an HTTP port is insufficient because the database protocol differs entirely. Instead, leverage native administrative utilities packaged inside the database image, such as pg_isready:
HEALTHCHECK --interval=10s --timeout=5s --retries=3 \
  CMD pg_isready -U postgres -d production_db || exit 1
For environments where lightweight base images omit utility tools like curl or wget, developers frequently create a dedicated minimal sidecar image or include a lightweight compiled binary specifically for executing the health check without bloating the main production runtime.
Why a Container Is Unhealthy
When a container transitions into an unhealthy state, it means the configured health check command has failed consecutively for a number of times equal to or exceeding the --retries threshold. Understanding why this happens requires investigating both the application logs and the exact execution output captured by Docker.
Common triggers for unhealthy transitions include database connection pool exhaustion, memory leaks causing garbage collection pauses that exceed the timeout limit, upstream API dependencies timing out, or misconfigured health check endpoints returning non-zero exit codes due to expired security certificates or improper routing paths. When a health check hangs indefinitely because a socket connection fails to return, Docker relies on the --timeout parameter to kill the hanging command process and log a failure. To diagnose these issues, developers should run docker inspect to view the exit code and error output of the last failing check, followed by inspecting standard container logs via docker logs to uncover underlying application exceptions.
Common Mistakes
Deploying container health checks incorrectly can introduce subtle bugs, performance bottlenecks, or security vulnerabilities into your infrastructure. Avoiding these frequent missteps ensures your monitoring layer remains robust and reliable.
First, a major mistake involves omitting the fail flag when using curl, as discussed previously. Using curl http://localhost/ without -f means a 500 server error still returns an exit code of zero, blinding your orchestration engine to actual application outages.
Second, setting intervals and timeouts too aggressively can create artificial resource contention. If your health check runs every two seconds with a one-second timeout on a heavy database container, the monitoring probes themselves will consume significant CPU and memory overhead, potentially degrading genuine user traffic performance.
Third, do not expose plaintext database passwords or sensitive API tokens directly inside Dockerfile or Compose health check command strings. Because Docker inspect stores configuration strings in plain text within metadata files accessible to any user with Docker daemon access, hardcoding credentials in health check CLI arguments represents a critical security vulnerability. Instead, inject credentials via secure environment variables or utilize internal authentication mechanisms that do not require plaintext secrets in the command definition.
📌 Recommended Next Guides & References
  <li>
    <a href="/article/docker-and-kubernetes-how-they-work-together-2" class="text-primary hover:underline font-semibold flex items-center gap-2">
      <span>→</span> <span>Docker and Kubernetes: How They Work Together</span>
    </a>
  </li>

  <li>
    <a href="/article/kubernetes-ingress-explained" class="text-primary hover:underline font-semibold flex items-center gap-2">
      <span>→</span> <span>Kubernetes Ingress Explained: Routing, Controllers, and TLS</span>
    </a>
  </li>

  <li>
    <a href="/article/kubernetes-ingress-controller-explained" class="text-primary hover:underline font-semibold flex items-center gap-2">
      <span>→</span> <span>Kubernetes Ingress Controller Explained: Architecture, Routing, and Implementation</span>
    </a>
  </li>