Quick Answer
Modern application deployment relies heavily on containerization, with Docker serving as the foundational tool for packaging software and its dependencies. However, running a containerized workload in production requires more than just ensuring the application process starts successfully. In traditional server environments, process managers monitor system services and restart them if they crash. In the world of containers, simply checking whether the main process PID 1 is alive is often insufficient for modern web applications, microservices, and distributed systems. An application process might be running, but it could be deadlocked, unable to connect to a crucial database, trapped in an infinite loop, or experiencing memory exhaustion. Without deeper monitoring, orchestrators and load balancers will continue sending user traffic to a fundamentally broken container. This leads to silent failures, dropped requests, and poor user experiences. To bridge this observability gap, Docker introduced native health check capabilities, allowing developers and system administrators to define automated mechanisms that continuously evaluate the actual internal state of a container rather than just checking its surface-level process status.
Introduction to Docker Healthcheck
Container monitoring has evolved significantly alongside cloud-native architectures. In the early days of Docker, operational monitoring was largely externalized. Administrators relied on host-level process checks or external monitoring agents to poll container endpoints. If the container process exited unexpectedly, Docker could restart it using restart policies like unless-stopped or always. But what happens when a web server process remains active while the internal thread pool is completely saturated, rendering the application entirely unresponsive? The operating system sees a healthy, running process, but your users see an error page. This fundamental limitation highlights why process status alone cannot guarantee application availability. The docker healthcheck feature was designed to solve this exact problem by shifting the definition of container health from mere process existence to functional operational capability. By executing internal commands inside the container at regular intervals, Docker can accurately determine whether the application is genuinely ready to process workloads. This mechanism transforms Docker from a basic packaging format into an intelligent runtime environment capable of proactive self-diagnosis and automated failure remediation, forming an essential pillar of resilient infrastructure design.
What is Docker HEALTHCHECK?
The Docker HEALTHCHECK instruction is a powerful feature built directly into the Dockerfile specification, allowing developers to define how a container should continuously monitor its own internal health. When you include a HEALTHCHECK instruction in your container build, you instruct the Docker daemon to periodically execute a specific command inside the running container. This command could be anything from a simple HTTP request using curl or wget, a custom script checking database connectivity, a file-system integrity check, or a specialized diagnostic utility tailored to your application stack. The command returns an exit code that dictates the container health state. An exit code of zero signals success, indicating that the container is healthy and operating normally. An exit code of one indicates failure, meaning the container is unhealthy and cannot fulfill its duties. Additionally, an exit code of two is reserved for reserved states, though it is less commonly utilized in custom scripts. This built-in instruction bridges the gap between infrastructure orchestration and application-layer awareness, enabling modern container platforms like Docker Swarm and Kubernetes to make intelligent routing and scaling decisions based on real-time runtime diagnostics rather than assumptions.
How Docker Health Checks Work
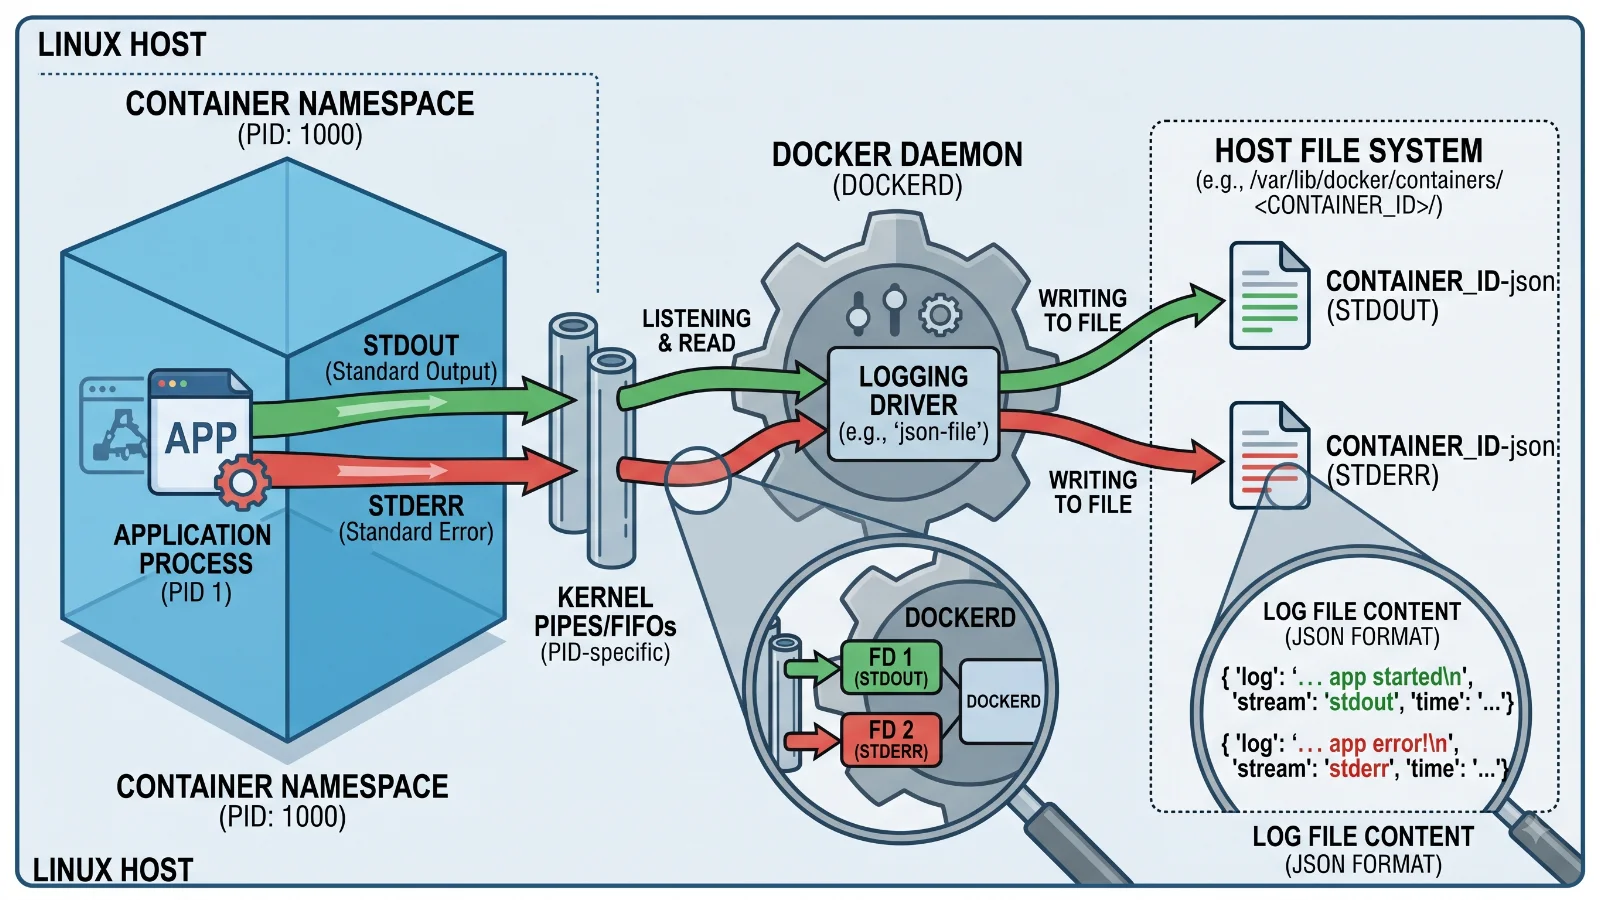
For more detail, see viewing container logs.
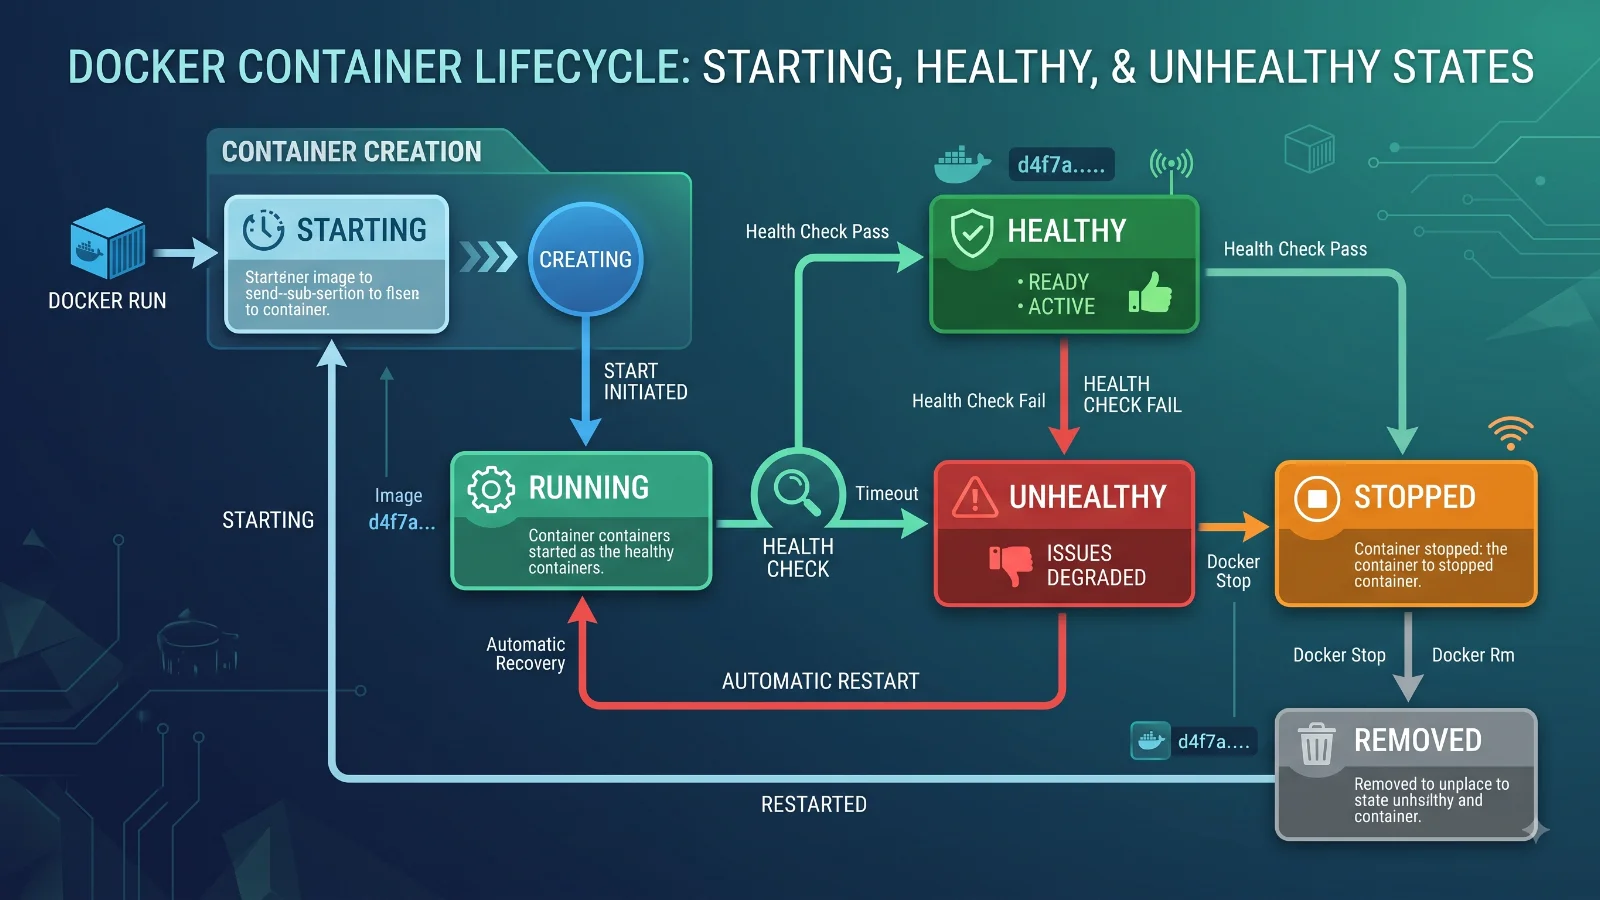
Understanding the underlying execution mechanics of Docker health checks is essential for tuning them correctly in production environments. When a container starts with a configured health check, it enters a startup phase controlled by the start-period parameter. During this initial grace period, any failing health checks do not count toward the maximum retry limit, giving resource-intensive applications ample time to boot up, initialize caches, and establish database connections without being prematurely flagged as broken. Once the start-period concludes, the Docker daemon initiates a continuous polling cycle governed by the interval parameter. At each interval, Docker spawns an isolated execution of the health check command inside the container namespace. The command must complete execution before the configured timeout threshold expires; otherwise, Docker marks that specific check execution as a failure due to timeout. To prevent transient network glitches or momentary high CPU spikes from triggering false alarms, Docker does not mark a container as unhealthy immediately upon a single failure. Instead, it tracks consecutive failures against the retries threshold. Only when the number of consecutive failed checks equals the configured retry limit does the container officially transition from its running state into an unhealthy status. This multi-phase evaluation model ensures high accuracy and prevents unnecessary flapping or container restarts.
Key Components and Parameters
Configuring container health monitoring requires a precise understanding of the parameters available in both the Dockerfile HEALTHCHECK instruction and the docker run command-line interface. These parameters allow you to fine-tune the monitoring behavior to match the specific startup characteristics and operational profile of your application workload. The primary configuration parameters include:
--interval=DURATION: Specifies how often Docker should execute the health check command. The default interval is thirty seconds, which is suitable for many standard applications, though high-throughput microservices may require shorter intervals such as ten seconds.--timeout=DURATION: Defines the maximum amount of time Docker will wait for the health check command to complete before considering it failed. If a command hangs or takes longer than this threshold, it is aborted and recorded as a failure. The default timeout is thirty seconds.--start-period=DURATION: Provides an initialization grace period for containers that require substantial boot time. Failed health checks during this period will not accumulate toward the retry count. The default is zero seconds.--retries=N: Sets the number of consecutive failures required before a container is officially transitioned to the unhealthy state. The default value is three.
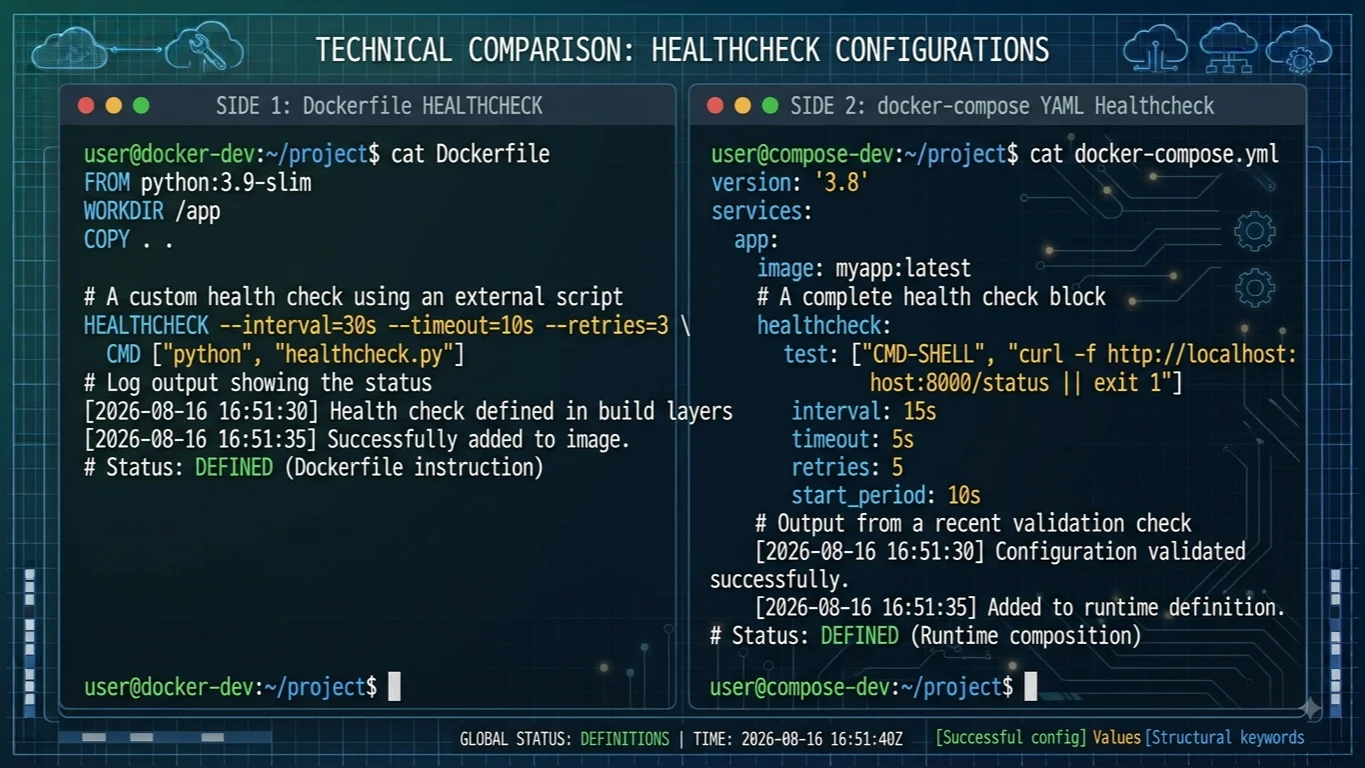
These flags can be declared directly inside your Dockerfile using the syntax HEALTHCHECK --interval=30s --timeout=3s --retries=3 CMD curl -f http://localhost/ || exit 1, or they can be overridden dynamically when starting containers via the command line or within multi-container orchestrations like Docker Compose.
Practical Docker Healthcheck Example
For more detail, see troubleshoot unhealthy containers.
To see how these concepts translate into a real-world implementation, let us examine a complete, practical example for a modern Node.js or Python web application using Express or Flask. Below is a production-ready Dockerfile that integrates a robust health check utilizing curl to query an internal diagnostic endpoint.
FROM node:18-alpine
WORKDIR /app
COPY package*.json ./
RUN npm ci --only=production
COPY . .
EXPOSE 8080

HEALTHCHECK --interval=15s --timeout=5s --start-period=10s --retries=3 \
  CMD curl -f http://localhost:8080/health || exit 1

USER node
CMD ["node", "server.js"]
In this Dockerfile, the health check is configured to run every fifteen seconds, waiting up to five seconds for a response. It allows a ten-second startup grace period for Node.js to initialize its runtime environment and connect to external data stores, and requires three consecutive failures before marking the container unhealthy. When deploying this container stack using Docker Compose, you can define or even override these health parameters directly within your compose file as shown below:
version: '3.8'
services:
  web:
    build: .
    ports:
      - "8080:8080"
    healthcheck:
      test: ["CMD", "curl", "-f", "http://localhost:8080/health"]
      interval: 20s
      timeout: 10s
      retries: 3
      start_period: 15s
This level of configuration ensures that your orchestration engine maintains continuous visibility into the runtime health of your services.
Benefits of Using Health Checks
Implementing robust health checks across your containerized infrastructure yields numerous operational advantages that directly improve application uptime and reliability. First and foremost, health checks enable automated recovery. In complex microservice architectures, developers often write custom daemon scripts or supervisor utilities to restart failed components; however, native Docker health checks integrate seamlessly with container orchestration platforms. When a container transitions to an unhealthy state, orchestrators like Docker Swarm can automatically terminate and replace the degraded instance with a fresh, functioning container without manual intervention. Second, health checks improve load balancer integration. Modern reverse proxies and API gateways query the Docker daemon or orchestration API to determine container status, ensuring that incoming HTTP traffic is routed exclusively to containers that have passed their health evaluation and are actively ready to serve requests. This eliminates the dreaded 502 Bad Gateway errors that occur when traffic hits a newly started container before its internal web server has fully initialized. Finally, comprehensive health checks provide development and operations teams with precise diagnostic visibility, making it infinitely easier to audit cluster health using standard command-line tools.
Limitations and Gotchas
While Docker health checks are exceptionally powerful, developers must remain mindful of common pitfalls and potential limitations to avoid introducing unintended performance bottlenecks or security vulnerabilities into their pipelines. One major gotcha involves resource overhead. Because health checks execute commands inside the container namespace at regular intervals, running heavy shell scripts, complex database queries, or resource-intensive diagnostic tools every few seconds can inadvertently consume valuable CPU and memory resources, degrading overall application performance. Another frequent mistake is misconfiguring the start-period parameter. If the start period is set too short, applications with lengthy initialization phases will frequently trigger false positive failures, causing endless restart loops during deployment. Additionally, developers must consider the security implications of embedded testing tools. Using tools like curl or wget inside production containers increases the image attack surface and payload size if those binaries are not already required by the application runtime. Whenever possible, utilize lightweight shell-builtin checks or native runtime HTTP requests to minimize unnecessary dependencies within your minimal base images, such as Alpine Linux.
Frequently Asked Questions
How do I check the health status of a running Docker container?
You can check the health status of any running container by executing the command docker inspect --format='{{json .State.Health}}' <container_name_or_id>. Alternatively, running standard docker ps will display the overall health status in parentheses within the STATUS column, such as Up 2 hours (healthy).
What is the difference between container exit status and health status?
Container exit status reflects whether the primary container process PID 1 is running or has terminated. Health status, by contrast, reflects the internal functional state of the application as determined by periodic execution of the HEALTHCHECK instruction, providing deep operational insight beyond basic process existence.
How do I troubleshoot an unhealthy Docker container?
To troubleshoot an unhealthy container, start by inspecting the health check logs using docker inspect <container_id> to view the exit codes and output of recent check executions. You can also execute an interactive shell inside the container using docker exec -it <container_id> sh to manually run the health check command and diagnose underlying configuration or connectivity errors.
Can I override the HEALTHCHECK instruction set in the Dockerfile at runtime?
Yes, you can easily override or disable a container health check at runtime. When running a container via the command line, you can pass the --health-cmd flag, or you can completely disable health checks inherited from a base image by setting --health-cmd=none during docker run or within your Docker Compose service definitions.
Conclusion
Mastering Docker health check configuration is a critical skill for any developer, DevOps engineer, or system administrator building modern containerized applications. Relying solely on process existence is no longer sufficient in complex distributed environments where applications can suffer from internal deadlocks, resource starvation, and silent failures while their primary process remains active. By integrating thoughtful HEALTHCHECK instructions into your Dockerfiles and orchestration configurations, you empower your infrastructure to autonomously detect failures, route traffic safely, and execute automated recoveries. Whether you are running simple microservices or massive multi-tier enterprise platforms, implementing proactive container monitoring ensures maximum uptime, resilient load balancing, and a seamless experience for your end users. Start auditing and upgrading your Docker deployments with robust health checks today to achieve true operational excellence.
📌 Recommended Next Guides & References
  <li>
    <a href="/article/docker-and-kubernetes-how-they-work-together-2" class="text-primary hover:underline font-semibold flex items-center gap-2">
      <span>→</span> <span>Docker and Kubernetes: How They Work Together</span>
    </a>
  </li>

  <li>
    <a href="/article/kubernetes-ingress-explained" class="text-primary hover:underline font-semibold flex items-center gap-2">
      <span>→</span> <span>Kubernetes Ingress Explained: Routing, Controllers, and TLS</span>
    </a>
  </li>

  <li>
    <a href="/article/kubernetes-ingress-controller-explained" class="text-primary hover:underline font-semibold flex items-center gap-2">
      <span>→</span> <span>Kubernetes Ingress Controller Explained: Architecture, Routing, and Implementation</span>
    </a>
  </li>